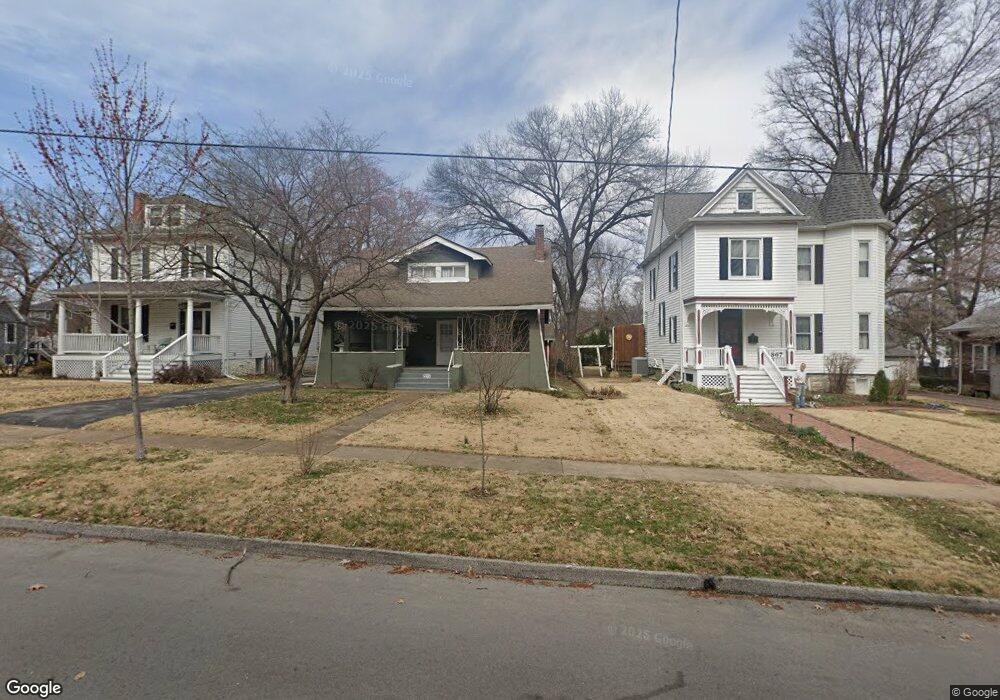
859 Newport Ave Saint Louis, MO 63119
Estimated Value: $426,000 - $563,000
5
Beds
2
Baths
1,752
Sq Ft
$280/Sq Ft
Est. Value
About This Home
This home is located at 859 Newport Ave, Saint Louis, MO 63119 and is currently estimated at $491,137, approximately $280 per square foot. 859 Newport Ave is a home located in St. Louis County with nearby schools including Avery Elementary School, Hixson Middle School, and Webster Groves High School.
Ownership History
Date
Name
Owned For
Owner Type
Purchase Details
Closed on
Sep 13, 2011
Sold by
Patrick Darrin and Patrick Amie
Bought by
Ballard Julia
Current Estimated Value
Home Financials for this Owner
Home Financials are based on the most recent Mortgage that was taken out on this home.
Original Mortgage
$228,000
Outstanding Balance
$156,728
Interest Rate
4.34%
Mortgage Type
New Conventional
Estimated Equity
$334,409
Purchase Details
Closed on
Jul 15, 2003
Sold by
Cowin Timothy J and Cowin Jill A
Bought by
Patrick Darrin and Patrick Amie
Home Financials for this Owner
Home Financials are based on the most recent Mortgage that was taken out on this home.
Original Mortgage
$185,000
Interest Rate
5.19%
Mortgage Type
Stand Alone First
Purchase Details
Closed on
Aug 28, 1998
Sold by
Liii Jones Joseph and Liii Karolyn E
Bought by
Cowin Timothy J and Cowin Jill A
Home Financials for this Owner
Home Financials are based on the most recent Mortgage that was taken out on this home.
Original Mortgage
$160,140
Interest Rate
6.94%
Mortgage Type
VA
Create a Home Valuation Report for This Property
The Home Valuation Report is an in-depth analysis detailing your home's value as well as a comparison with similar homes in the area
Home Values in the Area
Average Home Value in this Area
Purchase History
| Date | Buyer | Sale Price | Title Company |
|---|---|---|---|
| Ballard Julia | $239,176 | Investors Title Co Clayton | |
| Patrick Darrin | $231,250 | -- | |
| Cowin Timothy J | -- | -- |
Source: Public Records
Mortgage History
| Date | Status | Borrower | Loan Amount |
|---|---|---|---|
| Open | Ballard Julia | $228,000 | |
| Previous Owner | Patrick Darrin | $185,000 | |
| Previous Owner | Cowin Timothy J | $160,140 |
Source: Public Records
Tax History Compared to Growth
Tax History
| Year | Tax Paid | Tax Assessment Tax Assessment Total Assessment is a certain percentage of the fair market value that is determined by local assessors to be the total taxable value of land and additions on the property. | Land | Improvement |
|---|---|---|---|---|
| 2025 | $4,270 | $68,820 | $46,820 | $22,000 |
| 2024 | $4,270 | $61,220 | $34,050 | $27,170 |
| 2023 | $4,249 | $61,220 | $34,050 | $27,170 |
| 2022 | $4,132 | $55,270 | $34,050 | $21,220 |
| 2021 | $4,118 | $55,270 | $34,050 | $21,220 |
| 2020 | $3,897 | $48,700 | $34,050 | $14,650 |
| 2019 | $3,869 | $48,700 | $34,050 | $14,650 |
| 2018 | $4,067 | $45,490 | $23,850 | $21,640 |
| 2017 | $4,039 | $45,490 | $23,850 | $21,640 |
| 2016 | $3,664 | $39,470 | $20,430 | $19,040 |
| 2015 | $3,677 | $39,470 | $20,430 | $19,040 |
| 2014 | $4,057 | $42,410 | $15,640 | $26,770 |
Source: Public Records
Map
Nearby Homes
- 544 Summit Ave
- 808 Greeley Ave
- 946 Newport Ave
- 400 Marion Ave
- 554 N Laclede Station Rd
- 570 N Laclede Station Rd
- 7723 Suffolk Ave
- 716 Clark Ave
- 940 Brookside Ave
- 946 Marshall Ave Unit D
- 840 Marshall Ave
- 619 N Bompart Ave
- 1045 Tuxedo Blvd
- 1048 Kuhlman Ln
- 1052 Kuhlman Ln
- 610 Cornelia Ave
- 1051 Kuhlman Ln
- 4126 Exeter Ave
- 1088 Key Ave W
- 4121 Shrewsbury Ave
- 855 Newport Ave
- 867 Newport Ave
- 869 Newport Ave
- 845 Newport Ave
- 871 Newport Ave
- 858 Providence Ave
- 852 Providence Ave
- 862 Providence Ave
- 843 Newport Ave
- 864 Providence Ave
- 872 Newport Ave
- 875 Newport Ave
- 868 Providence Ave
- 844 Providence Ave
- 868 Newport Ave
- 837 Newport Ave
- 866 Newport Ave
- 874 Providence Ave
- 840 Providence Ave
- 864 Newport Ave