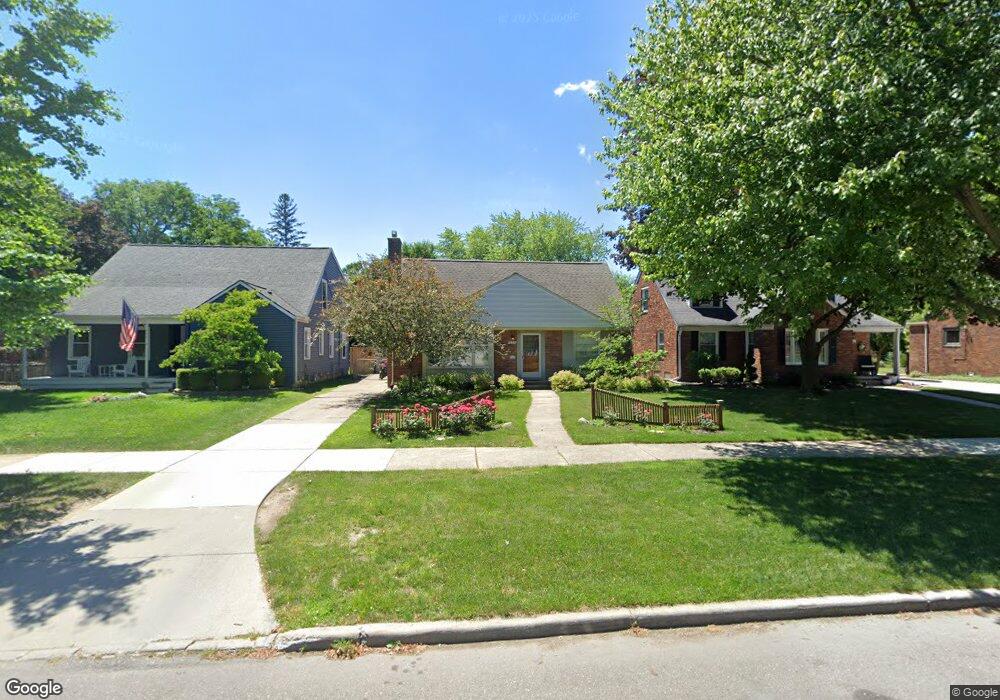
859 Rivard Blvd Grosse Pointe, MI 48230
Estimated Value: $338,000 - $450,000
3
Beds
1
Bath
1,468
Sq Ft
$266/Sq Ft
Est. Value
About This Home
This home is located at 859 Rivard Blvd, Grosse Pointe, MI 48230 and is currently estimated at $390,320, approximately $265 per square foot. 859 Rivard Blvd is a home located in Wayne County with nearby schools including Richard Elementary School, Brownell Middle School, and Grosse Pointe South High School.
Ownership History
Date
Name
Owned For
Owner Type
Purchase Details
Closed on
Jun 26, 2024
Sold by
Beard Misty M and Beard Kevin M
Bought by
Beard Misty M
Current Estimated Value
Home Financials for this Owner
Home Financials are based on the most recent Mortgage that was taken out on this home.
Original Mortgage
$155,000
Outstanding Balance
$150,642
Interest Rate
6.94%
Mortgage Type
New Conventional
Estimated Equity
$239,678
Purchase Details
Closed on
Apr 21, 2008
Sold by
Thurber Kathryn and Thurber Kathryn F
Bought by
Beard Kevin M
Home Financials for this Owner
Home Financials are based on the most recent Mortgage that was taken out on this home.
Original Mortgage
$133,900
Interest Rate
6.17%
Mortgage Type
FHA
Purchase Details
Closed on
Oct 29, 1996
Sold by
Lauren M Crow and Lauren E
Bought by
Kathryn Thurber
Create a Home Valuation Report for This Property
The Home Valuation Report is an in-depth analysis detailing your home's value as well as a comparison with similar homes in the area
Home Values in the Area
Average Home Value in this Area
Purchase History
| Date | Buyer | Sale Price | Title Company |
|---|---|---|---|
| Beard Misty M | -- | None Listed On Document | |
| Beard Kevin M | $135,000 | Capital Title Ins Agency | |
| Kathryn Thurber | $140,000 | -- |
Source: Public Records
Mortgage History
| Date | Status | Borrower | Loan Amount |
|---|---|---|---|
| Open | Beard Misty M | $155,000 | |
| Previous Owner | Beard Kevin M | $133,900 |
Source: Public Records
Tax History
| Year | Tax Paid | Tax Assessment Tax Assessment Total Assessment is a certain percentage of the fair market value that is determined by local assessors to be the total taxable value of land and additions on the property. | Land | Improvement |
|---|---|---|---|---|
| 2025 | $4,062 | $173,500 | $0 | $0 |
| 2024 | $3,925 | $173,200 | $0 | $0 |
| 2023 | $3,743 | $156,600 | $0 | $0 |
| 2022 | $5,417 | $140,900 | $0 | $0 |
| 2021 | $5,137 | $142,800 | $0 | $0 |
| 2019 | $4,209 | $106,200 | $0 | $0 |
| 2018 | $2,563 | $99,500 | $0 | $0 |
| 2017 | $2,706 | $98,400 | $0 | $0 |
| 2016 | $3,857 | $102,400 | $0 | $0 |
| 2015 | $7,314 | $90,700 | $0 | $0 |
| 2013 | $7,086 | $73,800 | $0 | $0 |
| 2012 | -- | $69,200 | $0 | $0 |
Source: Public Records
Map
Nearby Homes
- 17590 Mack Ave Unit 8
- 17540 Mack Ave Unit 10
- 719 Fisher Rd
- 4082 Hereford St
- 341 Mcmillan Rd
- 256 Fisher Rd
- 4104 Woodhall St
- 407 Moran Rd
- 614 Rivard Blvd
- 4496 Radnor St
- 3808 Cadieux Rd
- 4383 Neff Ave
- 4528 Farmbrook St
- 4522 Hereford St
- 577 Washington Rd
- 3950 Cadieux Rd
- 3930 Cadieux Rd
- 314 Mount Vernon Ave
- 17179 Detroit St
- 302 Mount Vernon Ave
- 853 Rivard Blvd
- 899 Rivard Blvd
- 863 Rivard Blvd
- 849 Rivard Blvd
- 868 Rivard Blvd
- 896 Rivard Blvd
- 862 University Place
- 866 University Place
- 856 University Place
- 843 Rivard Blvd
- 873 Rivard Blvd
- 852 University Place
- 876 University Place
- 846 University Place
- 839 Rivard Blvd
- 864 Rivard Blvd
- 879 Rivard Blvd
- 872 Rivard Blvd
- 882 Rivard Blvd
- 882 Rivard Blvd
Your Personal Tour Guide
Ask me questions while you tour the home.