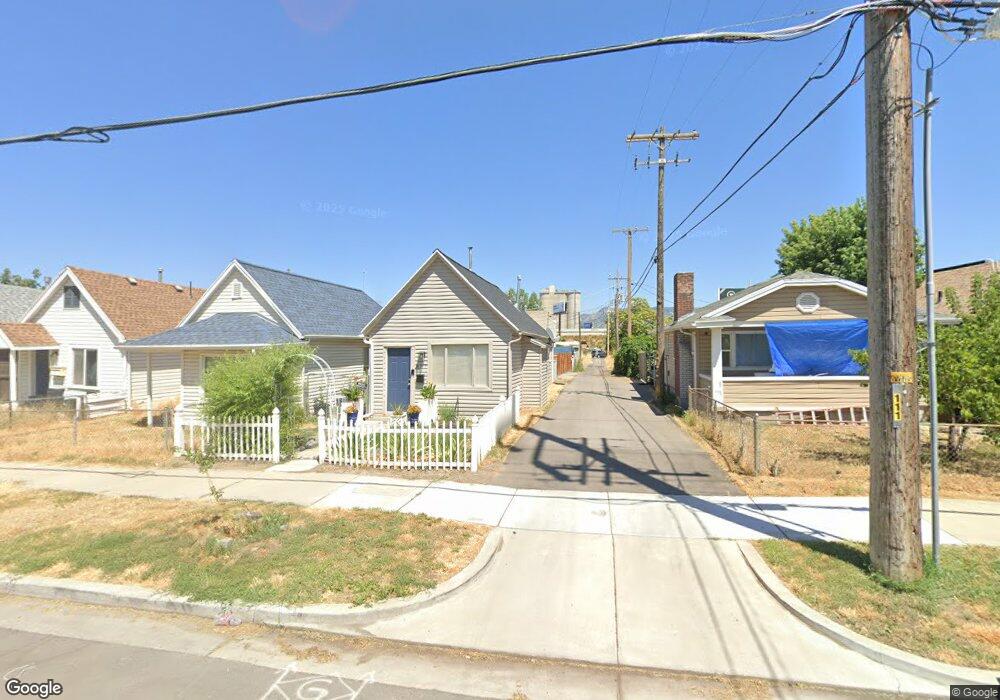
859 S 800 W Salt Lake City, UT 84104
Poplar Grove NeighborhoodEstimated Value: $261,304 - $312,000
1
Bed
1
Bath
628
Sq Ft
$448/Sq Ft
Est. Value
About This Home
This home is located at 859 S 800 W, Salt Lake City, UT 84104 and is currently estimated at $281,101, approximately $447 per square foot. 859 S 800 W is a home located in Salt Lake County with nearby schools including Riley Elementary School, Glendale Middle, and Highland High School.
Ownership History
Date
Name
Owned For
Owner Type
Purchase Details
Closed on
Apr 17, 2024
Sold by
857 S and Northcrest Holdings Llc
Bought by
Monroy Ann Marie
Current Estimated Value
Home Financials for this Owner
Home Financials are based on the most recent Mortgage that was taken out on this home.
Original Mortgage
$255,500
Outstanding Balance
$251,682
Interest Rate
6.88%
Mortgage Type
New Conventional
Estimated Equity
$29,419
Purchase Details
Closed on
Oct 6, 2020
Sold by
Rfg 3 Llc
Bought by
857 S A Series Of Northcrest Holdings Ll
Purchase Details
Closed on
Nov 17, 2014
Sold by
Baird Nation Llc
Bought by
Rfg 3 Llc
Purchase Details
Closed on
Oct 10, 2013
Sold by
Watson Ronald B and Watson Patricia B
Bought by
Baird Nation Llc
Create a Home Valuation Report for This Property
The Home Valuation Report is an in-depth analysis detailing your home's value as well as a comparison with similar homes in the area
Home Values in the Area
Average Home Value in this Area
Purchase History
| Date | Buyer | Sale Price | Title Company |
|---|---|---|---|
| Monroy Ann Marie | -- | Real Advantage Title Insurance | |
| 857 S A Series Of Northcrest Holdings Ll | -- | Accommodation | |
| Rfg 3 Llc | -- | Pinnacle Title Co | |
| Baird Nation Llc | -- | Pinnacle Title Co |
Source: Public Records
Mortgage History
| Date | Status | Borrower | Loan Amount |
|---|---|---|---|
| Open | Monroy Ann Marie | $255,500 |
Source: Public Records
Tax History Compared to Growth
Tax History
| Year | Tax Paid | Tax Assessment Tax Assessment Total Assessment is a certain percentage of the fair market value that is determined by local assessors to be the total taxable value of land and additions on the property. | Land | Improvement |
|---|---|---|---|---|
| 2025 | $745 | $262,500 | $48,800 | $213,700 |
| 2024 | $745 | $142,200 | $46,100 | $96,100 |
| 2023 | $666 | $122,400 | $55,300 | $67,100 |
| 2022 | $730 | $126,000 | $54,300 | $71,700 |
| 2021 | $641 | $100,200 | $41,100 | $59,100 |
| 2020 | $623 | $92,600 | $36,700 | $55,900 |
| 2019 | $609 | $85,200 | $36,700 | $48,500 |
| 2018 | $552 | $75,200 | $29,200 | $46,000 |
| 2017 | $591 | $75,400 | $29,200 | $46,200 |
| 2016 | $564 | $68,400 | $32,700 | $35,700 |
| 2015 | $604 | $69,400 | $33,100 | $36,300 |
| 2014 | $559 | $63,700 | $31,600 | $32,100 |
Source: Public Records
Map
Nearby Homes