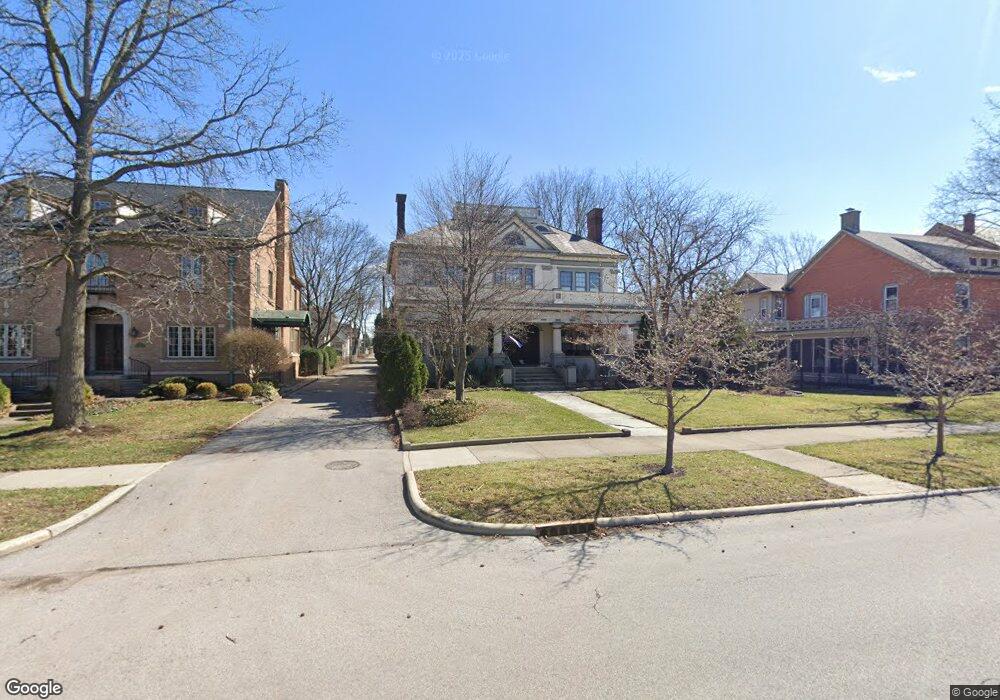
859 S Main St Findlay, OH 45840
Estimated Value: $449,150 - $539,000
4
Beds
3
Baths
3,897
Sq Ft
$126/Sq Ft
Est. Value
About This Home
This home is located at 859 S Main St, Findlay, OH 45840 and is currently estimated at $492,788, approximately $126 per square foot. 859 S Main St is a home located in Hancock County with nearby schools including Lincoln Elementary School, Donnell Middle School, and Findlay High School.
Ownership History
Date
Name
Owned For
Owner Type
Purchase Details
Closed on
Mar 18, 2016
Sold by
Red Legger Holdings Llc
Bought by
Pohl Charles B and Harding Keturah A
Current Estimated Value
Purchase Details
Closed on
Jan 8, 2013
Sold by
Beltz Scott K and Beltz Linda L
Bought by
Red Legger Holdings Llc
Home Financials for this Owner
Home Financials are based on the most recent Mortgage that was taken out on this home.
Original Mortgage
$403,750
Interest Rate
3.8%
Mortgage Type
Adjustable Rate Mortgage/ARM
Create a Home Valuation Report for This Property
The Home Valuation Report is an in-depth analysis detailing your home's value as well as a comparison with similar homes in the area
Home Values in the Area
Average Home Value in this Area
Purchase History
| Date | Buyer | Sale Price | Title Company |
|---|---|---|---|
| Pohl Charles B | -- | None Available | |
| Red Legger Holdings Llc | $425,000 | Mid American Title Agency |
Source: Public Records
Mortgage History
| Date | Status | Borrower | Loan Amount |
|---|---|---|---|
| Previous Owner | Red Legger Holdings Llc | $403,750 |
Source: Public Records
Tax History Compared to Growth
Tax History
| Year | Tax Paid | Tax Assessment Tax Assessment Total Assessment is a certain percentage of the fair market value that is determined by local assessors to be the total taxable value of land and additions on the property. | Land | Improvement |
|---|---|---|---|---|
| 2024 | $4,970 | $139,920 | $11,990 | $127,930 |
| 2023 | $4,978 | $139,920 | $11,990 | $127,930 |
| 2022 | $4,961 | $139,920 | $11,990 | $127,930 |
| 2021 | $5,426 | $133,310 | $12,000 | $121,310 |
| 2020 | $5,425 | $133,310 | $12,000 | $121,310 |
| 2019 | $5,316 | $133,310 | $12,000 | $121,310 |
| 2018 | $4,758 | $109,440 | $8,000 | $101,440 |
| 2017 | $4,759 | $109,440 | $8,000 | $101,440 |
| 2016 | $4,670 | $109,440 | $8,000 | $101,440 |
| 2015 | $4,202 | $93,440 | $6,590 | $86,850 |
| 2014 | $4,203 | $93,440 | $6,590 | $86,850 |
| 2012 | $3,268 | $74,140 | $6,590 | $67,550 |
Source: Public Records
Map
Nearby Homes