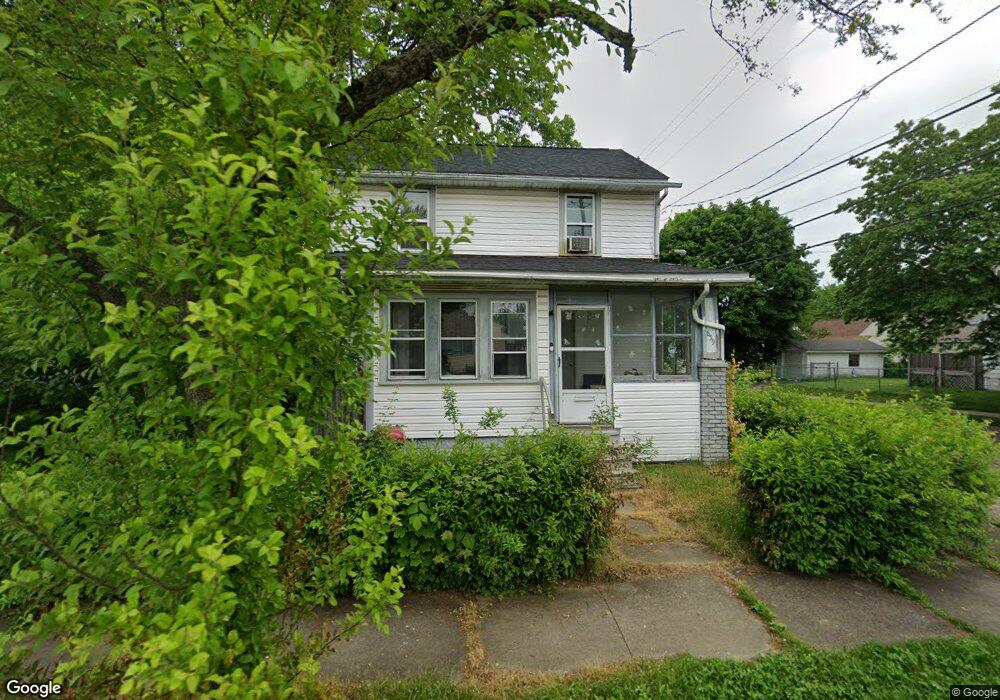
859 Saxon Ave Akron, OH 44314
Kenmore NeighborhoodEstimated Value: $82,000 - $96,000
2
Beds
1
Bath
944
Sq Ft
$94/Sq Ft
Est. Value
About This Home
This home is located at 859 Saxon Ave, Akron, OH 44314 and is currently estimated at $88,835, approximately $94 per square foot. 859 Saxon Ave is a home located in Summit County with nearby schools including Pfeiffer Elementary School, Emmanuel Christian Academy, and St. Bernard-St. Mary Elementary School.
Ownership History
Date
Name
Owned For
Owner Type
Purchase Details
Closed on
May 9, 2007
Sold by
Jp Morgan Chase Bank
Bought by
Godin Robert M and Godin Belinda
Current Estimated Value
Purchase Details
Closed on
Jan 9, 2007
Sold by
Figuero Arthur T
Bought by
Jp Morgan Chase Bank
Purchase Details
Closed on
Nov 30, 2000
Sold by
Estate Of Charlotte A Figuero
Bought by
Figuero Arthur T
Purchase Details
Closed on
Jan 19, 2000
Sold by
Shaffer Richard A
Bought by
Figuero Arthur T and Figuero Charlotte A
Home Financials for this Owner
Home Financials are based on the most recent Mortgage that was taken out on this home.
Original Mortgage
$50,150
Interest Rate
7.81%
Mortgage Type
Balloon
Purchase Details
Closed on
Jul 21, 1994
Sold by
Hickman Jack K
Bought by
Shaffer Richard A
Home Financials for this Owner
Home Financials are based on the most recent Mortgage that was taken out on this home.
Original Mortgage
$33,300
Interest Rate
8.38%
Mortgage Type
New Conventional
Create a Home Valuation Report for This Property
The Home Valuation Report is an in-depth analysis detailing your home's value as well as a comparison with similar homes in the area
Home Values in the Area
Average Home Value in this Area
Purchase History
| Date | Buyer | Sale Price | Title Company |
|---|---|---|---|
| Godin Robert M | $15,500 | Resource Title Agency Inc | |
| Jp Morgan Chase Bank | $44,000 | None Available | |
| Figuero Arthur T | -- | -- | |
| Figuero Arthur T | $43,000 | Bond & Associates Title Agen | |
| Shaffer Richard A | $37,000 | -- |
Source: Public Records
Mortgage History
| Date | Status | Borrower | Loan Amount |
|---|---|---|---|
| Previous Owner | Figuero Arthur T | $50,150 | |
| Previous Owner | Shaffer Richard A | $33,300 |
Source: Public Records
Tax History Compared to Growth
Tax History
| Year | Tax Paid | Tax Assessment Tax Assessment Total Assessment is a certain percentage of the fair market value that is determined by local assessors to be the total taxable value of land and additions on the property. | Land | Improvement |
|---|---|---|---|---|
| 2025 | $1,356 | $20,535 | $4,746 | $15,789 |
| 2024 | $1,356 | $20,535 | $4,746 | $15,789 |
| 2023 | $1,356 | $20,535 | $4,746 | $15,789 |
| 2022 | $1,223 | $14,162 | $3,273 | $10,889 |
| 2021 | $1,224 | $14,162 | $3,273 | $10,889 |
| 2020 | $1,153 | $14,160 | $3,270 | $10,890 |
| 2019 | $1,205 | $13,580 | $3,880 | $9,700 |
| 2018 | $1,152 | $13,580 | $3,880 | $9,700 |
| 2017 | $1,242 | $13,580 | $3,880 | $9,700 |
| 2016 | $1,243 | $14,600 | $3,880 | $10,720 |
| 2015 | $1,242 | $14,600 | $3,880 | $10,720 |
| 2014 | $1,233 | $14,600 | $3,880 | $10,720 |
| 2013 | $1,211 | $14,600 | $3,880 | $10,720 |
Source: Public Records
Map
Nearby Homes
- 788 Saxon Ave
- 809 Lakewood Blvd
- 771 Indian Trail
- 905 National Ave
- 936 Jason Ave
- 828 Marie Ave
- 1637 East Ave Unit 1639
- 980 Jason Ave
- 1866 17th St SW
- 785 Silvercrest Ave
- 918 Silvercrest Ave
- 1940 8th St SW
- 0 East Ave
- 2001 13th St SW
- 2016 13th St SW
- 545 Thelma Ave
- 543 Thelma Ave
- 546 Thelma Ave
- 539 Thelma Ave
- 646 Chester Ave
- 851 Saxon Ave
- 869 Saxon Ave
- 860 Lakewood Blvd
- 860 Lakewood Blvd
- 847 Saxon Ave
- 866 Saxon Ave
- 875 Saxon Ave
- 860 Saxon Ave
- 852 Saxon Ave
- 843 Saxon Ave
- 848 Lakewood Blvd
- 870 Saxon Ave
- 872 Lakewood Blvd
- 874 Saxon Ave
- 844 Lakewood Blvd
- 848 Saxon Ave
- 881 Saxon Ave
- 839 Saxon Ave
- 878 Saxon Ave
- 880 Lakewood Blvd