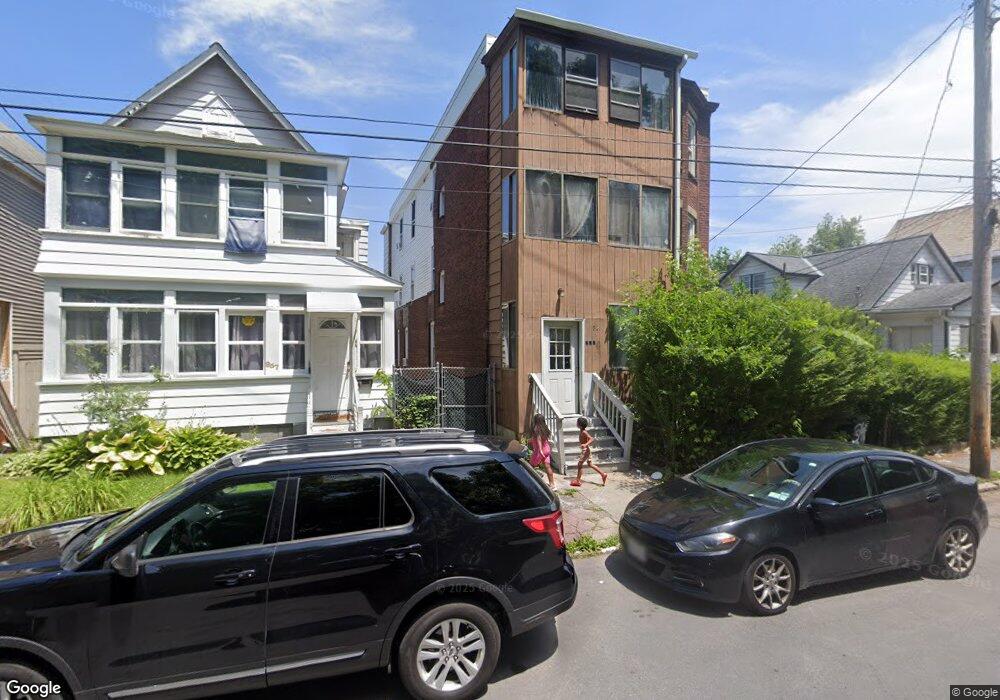
859 Strong St Schenectady, NY 12307
Hamilton Hill NeighborhoodEstimated Value: $217,101 - $526,000
6
Beds
3
Baths
3,372
Sq Ft
$95/Sq Ft
Est. Value
About This Home
This home is located at 859 Strong St, Schenectady, NY 12307 and is currently estimated at $321,025, approximately $95 per square foot. 859 Strong St is a home located in Schenectady County with nearby schools including Pleasant Valley School, Mont Pleasant Middle School, and Schenectady High School.
Ownership History
Date
Name
Owned For
Owner Type
Purchase Details
Closed on
Apr 8, 2025
Sold by
Selka Moshe
Bought by
Strong St Llc
Current Estimated Value
Home Financials for this Owner
Home Financials are based on the most recent Mortgage that was taken out on this home.
Original Mortgage
$243,750
Outstanding Balance
$242,668
Interest Rate
6.65%
Mortgage Type
New Conventional
Estimated Equity
$78,357
Purchase Details
Closed on
Apr 6, 2022
Sold by
Yagwantie Sewah
Bought by
Selka Moshe
Home Financials for this Owner
Home Financials are based on the most recent Mortgage that was taken out on this home.
Original Mortgage
$136,000
Interest Rate
4.72%
Mortgage Type
New Conventional
Purchase Details
Closed on
Dec 12, 2006
Sold by
Petta Michael
Bought by
Sewah Yagwantie
Home Financials for this Owner
Home Financials are based on the most recent Mortgage that was taken out on this home.
Original Mortgage
$83,700
Interest Rate
8.65%
Mortgage Type
Adjustable Rate Mortgage/ARM
Purchase Details
Closed on
Mar 4, 1999
Create a Home Valuation Report for This Property
The Home Valuation Report is an in-depth analysis detailing your home's value as well as a comparison with similar homes in the area
Home Values in the Area
Average Home Value in this Area
Purchase History
| Date | Buyer | Sale Price | Title Company |
|---|---|---|---|
| Strong St Llc | -- | None Listed On Document | |
| Strong St Llc | -- | None Listed On Document | |
| Selka Moshe | $170,000 | First American Title | |
| Selka Moshe | $170,000 | First American Title | |
| Sewah Yagwantie | $93,000 | Stan Skubis | |
| -- | $28,000 | -- |
Source: Public Records
Mortgage History
| Date | Status | Borrower | Loan Amount |
|---|---|---|---|
| Open | Strong St Llc | $243,750 | |
| Closed | Strong St Llc | $243,750 | |
| Previous Owner | Selka Moshe | $136,000 | |
| Previous Owner | Sewah Yagwantie | $83,700 |
Source: Public Records
Tax History Compared to Growth
Tax History
| Year | Tax Paid | Tax Assessment Tax Assessment Total Assessment is a certain percentage of the fair market value that is determined by local assessors to be the total taxable value of land and additions on the property. | Land | Improvement |
|---|---|---|---|---|
| 2024 | $6,727 | $97,800 | $13,300 | $84,500 |
| 2023 | $6,397 | $97,800 | $13,300 | $84,500 |
| 2022 | $5,782 | $88,900 | $13,300 | $75,600 |
| 2021 | $5,728 | $88,900 | $13,300 | $75,600 |
| 2020 | $5,610 | $88,900 | $13,300 | $75,600 |
| 2019 | $3,767 | $88,900 | $13,300 | $75,600 |
| 2018 | $5,654 | $88,900 | $13,300 | $75,600 |
| 2017 | $4,534 | $88,900 | $13,300 | $75,600 |
| 2016 | $5,749 | $88,900 | $13,300 | $75,600 |
| 2015 | -- | $88,900 | $13,300 | $75,600 |
| 2014 | -- | $88,900 | $13,300 | $75,600 |
Source: Public Records
Map
Nearby Homes