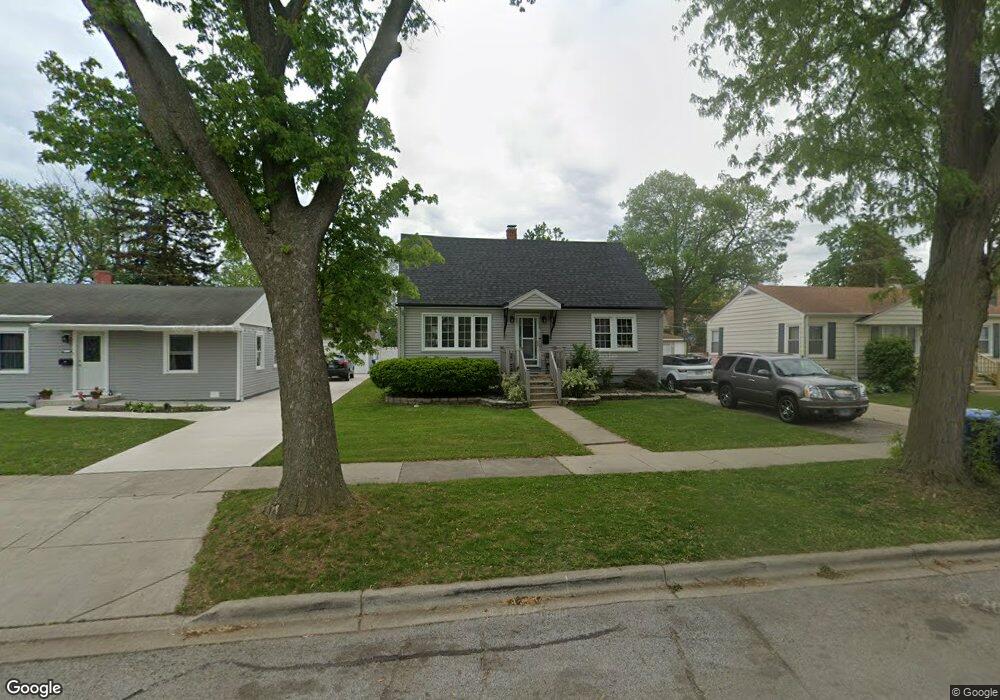
859 Webster Ln Des Plaines, IL 60016
Estimated Value: $379,000 - $443,000
3
Beds
2
Baths
1,581
Sq Ft
$260/Sq Ft
Est. Value
About This Home
This home is located at 859 Webster Ln, Des Plaines, IL 60016 and is currently estimated at $411,649, approximately $260 per square foot. 859 Webster Ln is a home located in Cook County with nearby schools including Forest Elementary School, Algonquin Middle School, and Maine West High School.
Ownership History
Date
Name
Owned For
Owner Type
Purchase Details
Closed on
May 26, 2005
Sold by
Lantz Pamela S
Bought by
Thomas James A and Peak Jane
Current Estimated Value
Home Financials for this Owner
Home Financials are based on the most recent Mortgage that was taken out on this home.
Original Mortgage
$244,000
Outstanding Balance
$125,324
Interest Rate
5.91%
Mortgage Type
Fannie Mae Freddie Mac
Estimated Equity
$286,325
Create a Home Valuation Report for This Property
The Home Valuation Report is an in-depth analysis detailing your home's value as well as a comparison with similar homes in the area
Home Values in the Area
Average Home Value in this Area
Purchase History
| Date | Buyer | Sale Price | Title Company |
|---|---|---|---|
| Thomas James A | $305,000 | Pntn | |
| Lantz Pamela | -- | Pntn |
Source: Public Records
Mortgage History
| Date | Status | Borrower | Loan Amount |
|---|---|---|---|
| Open | Thomas James A | $244,000 | |
| Closed | Thomas James A | $61,000 |
Source: Public Records
Tax History
| Year | Tax Paid | Tax Assessment Tax Assessment Total Assessment is a certain percentage of the fair market value that is determined by local assessors to be the total taxable value of land and additions on the property. | Land | Improvement |
|---|---|---|---|---|
| 2025 | $7,299 | $35,000 | $6,075 | $28,925 |
| 2024 | $7,299 | $31,001 | $5,063 | $25,938 |
| 2023 | $7,096 | $31,001 | $5,063 | $25,938 |
| 2022 | $7,096 | $31,001 | $5,063 | $25,938 |
| 2021 | $5,309 | $20,603 | $4,050 | $16,553 |
| 2020 | $5,289 | $20,603 | $4,050 | $16,553 |
| 2019 | $5,238 | $22,893 | $4,050 | $18,843 |
| 2018 | $6,748 | $25,999 | $3,543 | $22,456 |
| 2017 | $6,646 | $25,999 | $3,543 | $22,456 |
| 2016 | $6,531 | $25,999 | $3,543 | $22,456 |
| 2015 | $5,342 | $20,292 | $3,037 | $17,255 |
| 2014 | $5,245 | $20,292 | $3,037 | $17,255 |
| 2013 | $5,097 | $20,292 | $3,037 | $17,255 |
Source: Public Records
Map
Nearby Homes
- 886 E Thacker St
- 1107 E Prairie Ave
- 1048 E Walnut Ave
- 982 W Villa Dr
- 1277 E Thacker St Unit 303
- 980 W Grant Dr
- 584 S 4th Ave
- 609 E Thacker St
- 652 E Prairie Ave
- 787 Graceland Ave Unit 202B
- 1164 W Grant Dr
- 647 Parsons Ave
- 900 Center St Unit 3A
- 1380 Oakwood Ave Unit 306
- 556 Orchard Ct
- 905 Center St Unit B208
- 890 North Ave
- 821 Lexington Cir E
- 1325 Perry St Unit 606
- 508 Crestwood Dr
Your Personal Tour Guide
Ask me questions while you tour the home.