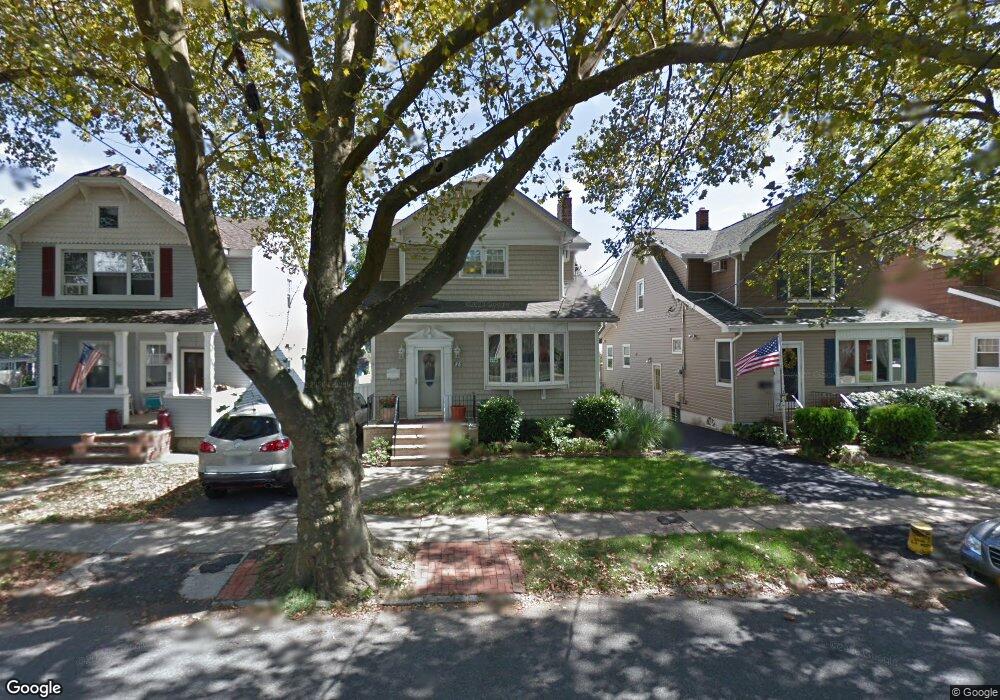
86 10th St Staten Island, NY 10306
New Dorp NeighborhoodEstimated Value: $805,000 - $984,000
--
Bed
4
Baths
2,333
Sq Ft
$375/Sq Ft
Est. Value
About This Home
This home is located at 86 10th St, Staten Island, NY 10306 and is currently estimated at $875,534, approximately $375 per square foot. 86 10th St is a home located in Richmond County with nearby schools including P.S. 41 The Stephanie a Vierno School, Is 2 George L Egbert, and New Dorp High School.
Ownership History
Date
Name
Owned For
Owner Type
Purchase Details
Closed on
Sep 25, 2003
Sold by
Ferguson John F and Ferguson Maureen
Bought by
Bridgman Thomas F and Bridgman Maureen P
Current Estimated Value
Home Financials for this Owner
Home Financials are based on the most recent Mortgage that was taken out on this home.
Original Mortgage
$300,000
Interest Rate
5.98%
Mortgage Type
Purchase Money Mortgage
Create a Home Valuation Report for This Property
The Home Valuation Report is an in-depth analysis detailing your home's value as well as a comparison with similar homes in the area
Home Values in the Area
Average Home Value in this Area
Purchase History
| Date | Buyer | Sale Price | Title Company |
|---|---|---|---|
| Bridgman Thomas F | $375,000 | Newell & Talarico Title |
Source: Public Records
Mortgage History
| Date | Status | Borrower | Loan Amount |
|---|---|---|---|
| Previous Owner | Bridgman Thomas F | $300,000 |
Source: Public Records
Tax History Compared to Growth
Tax History
| Year | Tax Paid | Tax Assessment Tax Assessment Total Assessment is a certain percentage of the fair market value that is determined by local assessors to be the total taxable value of land and additions on the property. | Land | Improvement |
|---|---|---|---|---|
| 2025 | $8,503 | $55,320 | $9,053 | $46,267 |
| 2024 | $8,503 | $59,040 | $8,003 | $51,037 |
| 2023 | $8,466 | $41,688 | $7,832 | $33,856 |
| 2022 | $8,035 | $50,940 | $11,160 | $39,780 |
| 2021 | $8,039 | $45,960 | $11,160 | $34,800 |
| 2020 | $7,620 | $43,020 | $11,160 | $31,860 |
| 2019 | $7,087 | $44,340 | $11,160 | $33,180 |
| 2018 | $6,784 | $34,740 | $11,160 | $23,580 |
| 2017 | $6,838 | $35,014 | $10,521 | $24,493 |
| 2016 | $6,294 | $33,033 | $10,704 | $22,329 |
| 2015 | $5,337 | $31,164 | $8,626 | $22,538 |
| 2014 | $5,337 | $29,400 | $9,300 | $20,100 |
Source: Public Records
Map
Nearby Homes