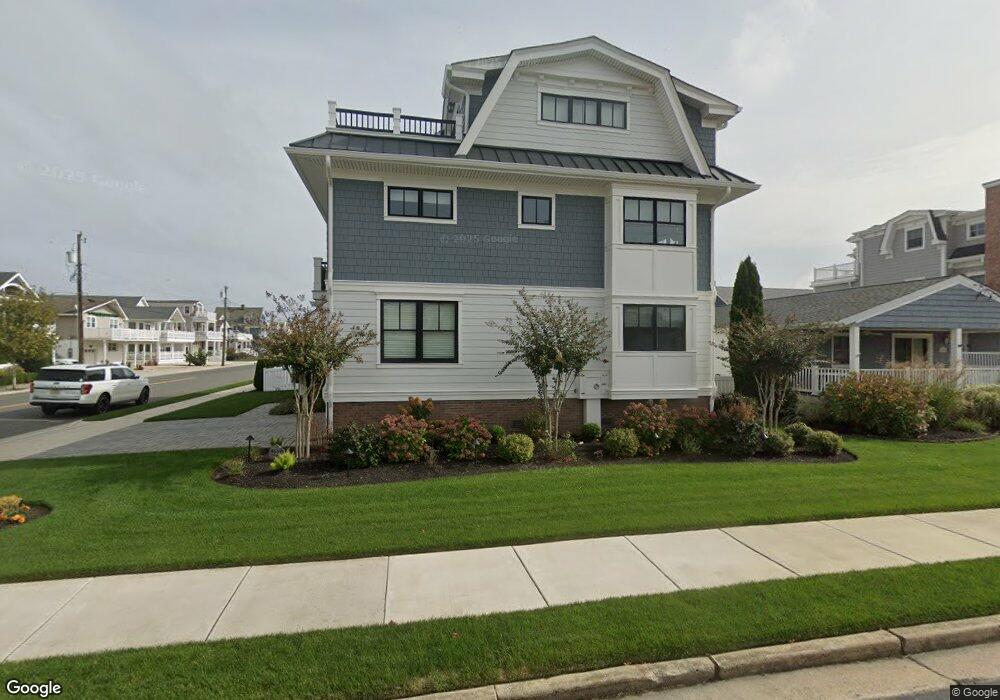
86 20th St W Avalon, NJ 08202
Estimated Value: $5,321,636 - $6,641,000
--
Bed
--
Bath
1,578
Sq Ft
$3,768/Sq Ft
Est. Value
About This Home
This home is located at 86 20th St W, Avalon, NJ 08202 and is currently estimated at $5,945,879, approximately $3,767 per square foot. 86 20th St W is a home located in Cape May County with nearby schools including Avalon Elementary School.
Ownership History
Date
Name
Owned For
Owner Type
Purchase Details
Closed on
Dec 17, 2018
Sold by
Corkhill Ft
Bought by
Cabano Stephen L and Cabano Diane L
Current Estimated Value
Home Financials for this Owner
Home Financials are based on the most recent Mortgage that was taken out on this home.
Original Mortgage
$1,200,000
Outstanding Balance
$1,059,336
Interest Rate
4.9%
Mortgage Type
New Conventional
Estimated Equity
$4,886,543
Purchase Details
Closed on
Jan 10, 2008
Sold by
Estate Of Nancy W Corkhill and Corkhill Richard W
Bought by
Corkhill Family Trust
Create a Home Valuation Report for This Property
The Home Valuation Report is an in-depth analysis detailing your home's value as well as a comparison with similar homes in the area
Home Values in the Area
Average Home Value in this Area
Purchase History
| Date | Buyer | Sale Price | Title Company |
|---|---|---|---|
| Cabano Stephen L | $150,000 | -- | |
| Corkhill Family Trust | -- | None Available |
Source: Public Records
Mortgage History
| Date | Status | Borrower | Loan Amount |
|---|---|---|---|
| Open | Cabano Stephen L | $1,200,000 |
Source: Public Records
Tax History Compared to Growth
Tax History
| Year | Tax Paid | Tax Assessment Tax Assessment Total Assessment is a certain percentage of the fair market value that is determined by local assessors to be the total taxable value of land and additions on the property. | Land | Improvement |
|---|---|---|---|---|
| 2025 | $23,089 | $3,760,500 | $1,250,000 | $2,510,500 |
| 2024 | $23,089 | $3,760,500 | $1,250,000 | $2,510,500 |
| 2023 | $22,658 | $3,720,500 | $1,250,000 | $2,470,500 |
| 2022 | $7,894 | $1,389,800 | $1,250,000 | $139,800 |
| 2021 | $7,602 | $1,389,800 | $1,250,000 | $139,800 |
| 2020 | $7,310 | $1,389,800 | $1,250,000 | $139,800 |
| 2019 | $7,088 | $1,389,800 | $1,250,000 | $139,800 |
| 2018 | $6,532 | $1,389,800 | $1,250,000 | $139,800 |
| 2017 | $5,726 | $1,074,900 | $945,000 | $129,900 |
| 2016 | $5,662 | $1,074,900 | $945,000 | $129,900 |
| 2015 | $5,565 | $1,074,900 | $945,000 | $129,900 |
| 2014 | $5,501 | $1,074,900 | $945,000 | $129,900 |
Source: Public Records
Map
Nearby Homes