Estimated Value: $380,392 - $414,000
4
Beds
1
Bath
1,736
Sq Ft
$226/Sq Ft
Est. Value
About This Home
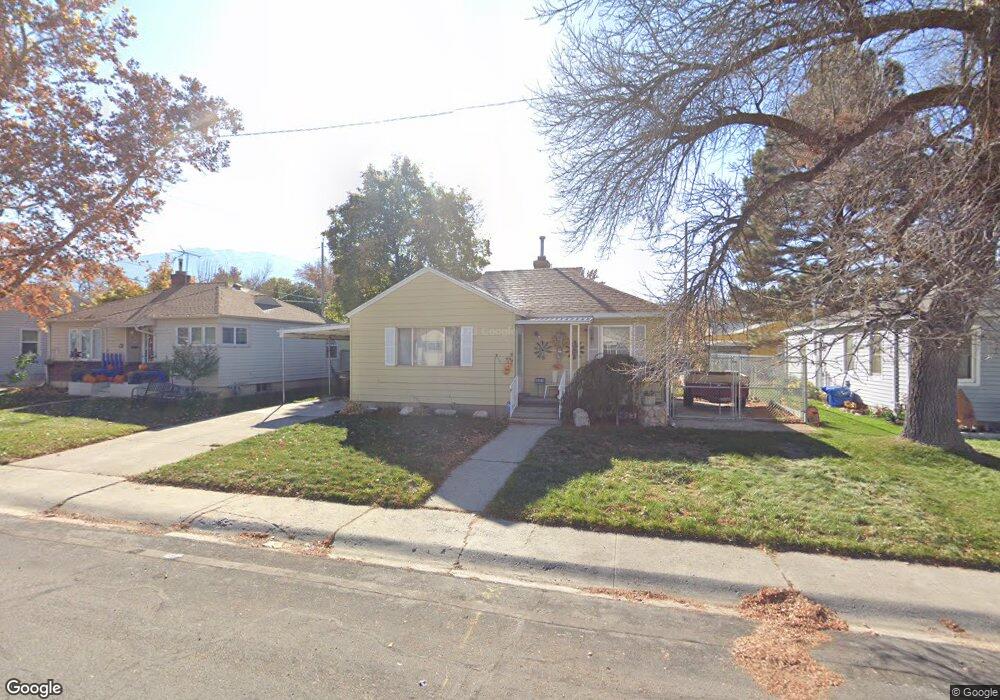
This home is located at 86 A St, Springville, UT 84663 and is currently estimated at $392,131, approximately $225 per square foot. 86 A St is a home located in Utah County with nearby schools including Brookside School, Springville Junior High School, and Springville High School.
Ownership History
Date
Name
Owned For
Owner Type
Purchase Details
Closed on
Apr 21, 2017
Sold by
Hancock Jeffrey and Hancock Jerrica
Bought by
Hancock Jeffrey and Hancock Jerrica
Current Estimated Value
Home Financials for this Owner
Home Financials are based on the most recent Mortgage that was taken out on this home.
Original Mortgage
$147,750
Outstanding Balance
$123,252
Interest Rate
4.3%
Mortgage Type
New Conventional
Estimated Equity
$268,879
Purchase Details
Closed on
Oct 5, 2011
Sold by
Money Lynda and Houser David
Bought by
Hancock Jeffery and Hancock Jerrica
Home Financials for this Owner
Home Financials are based on the most recent Mortgage that was taken out on this home.
Original Mortgage
$97,311
Interest Rate
3.75%
Mortgage Type
FHA
Purchase Details
Closed on
Sep 12, 1996
Sold by
Houser Lynn J and Lynn Houser J
Bought by
Houser J Lynn and Houser Anna Mae S
Create a Home Valuation Report for This Property
The Home Valuation Report is an in-depth analysis detailing your home's value as well as a comparison with similar homes in the area
Home Values in the Area
Average Home Value in this Area
Purchase History
| Date | Buyer | Sale Price | Title Company |
|---|---|---|---|
| Hancock Jeffrey | -- | Cottonwood Title | |
| Hancock Jeffery | -- | Cottonwood Title Insurance A | |
| Money Lynda | -- | Cottonwood Title Insurance A | |
| Houser J Lynn | -- | -- |
Source: Public Records
Mortgage History
| Date | Status | Borrower | Loan Amount |
|---|---|---|---|
| Open | Hancock Jeffrey | $147,750 | |
| Closed | Hancock Jeffery | $97,311 |
Source: Public Records
Tax History
| Year | Tax Paid | Tax Assessment Tax Assessment Total Assessment is a certain percentage of the fair market value that is determined by local assessors to be the total taxable value of land and additions on the property. | Land | Improvement |
|---|---|---|---|---|
| 2025 | $1,628 | $176,770 | -- | -- |
| 2024 | $1,628 | $166,760 | $0 | $0 |
| 2023 | $1,586 | $162,635 | $0 | $0 |
| 2022 | $1,678 | $168,960 | $0 | $0 |
| 2021 | $1,507 | $236,300 | $85,400 | $150,900 |
| 2020 | $1,385 | $210,500 | $71,200 | $139,300 |
| 2019 | $1,243 | $192,300 | $71,200 | $121,100 |
| 2018 | $1,260 | $186,000 | $68,000 | $118,000 |
| 2017 | $1,115 | $87,395 | $0 | $0 |
| 2016 | $954 | $73,370 | $0 | $0 |
| 2015 | $894 | $70,235 | $0 | $0 |
| 2014 | $890 | $69,520 | $0 | $0 |
Source: Public Records
Map
Nearby Homes
- 802 S Brookside Dr
- 805 E 400 S
- 1062 E 350 S
- 883 E 700 S
- 645 Swenson Ave Unit 5
- 645 Swenson Ave Unit 3
- 647 Swenson Ave Unit 3
- 1130 Hillcrest Dr
- 1185 Hillcrest Dr
- 445 E 535 S
- 677 E 800 South St
- 585 S 400 E
- 1361 E 400 S
- 616 E Aaron Ave
- 949 S 1060 E
- 579 E 800 St S
- 629 E 800 St S
- 511 S 300 E Unit 2
- 557 S 1470 E
- 625 S 200 E
Your Personal Tour Guide
Ask me questions while you tour the home.