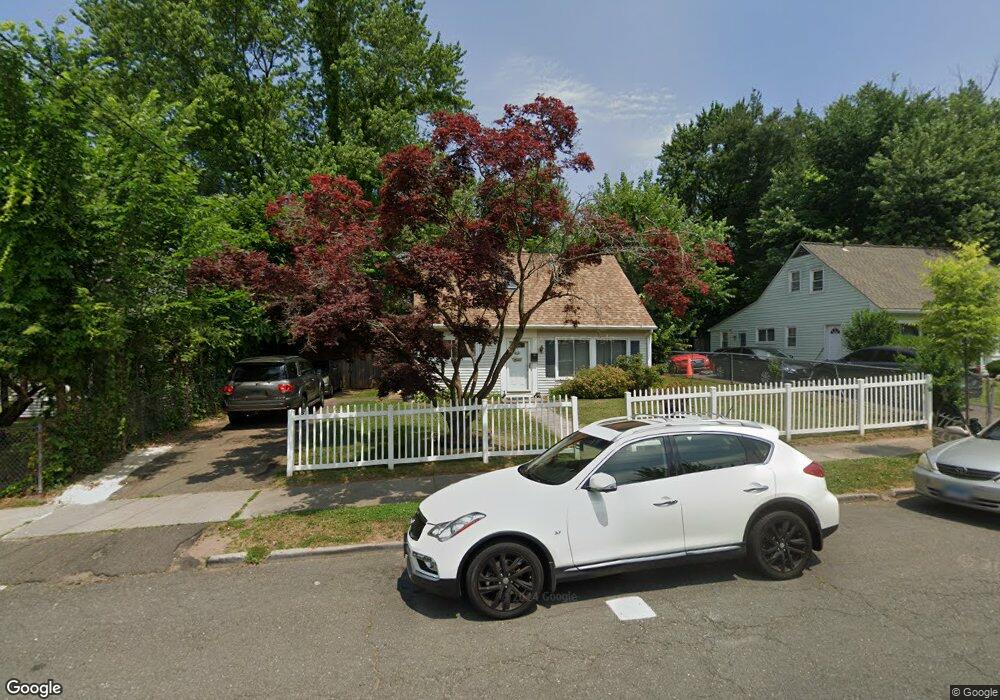
86 Andover St Hartford, CT 06112
Blue Hills NeighborhoodEstimated Value: $227,369 - $278,000
3
Beds
2
Baths
899
Sq Ft
$272/Sq Ft
Est. Value
About This Home
This home is located at 86 Andover St, Hartford, CT 06112 and is currently estimated at $244,092, approximately $271 per square foot. 86 Andover St is a home located in Hartford County with nearby schools including Rawson School, Breakthrough Magnet School - North Campus, and West Middle School.
Ownership History
Date
Name
Owned For
Owner Type
Purchase Details
Closed on
Aug 10, 2009
Sold by
Stewart Kwame and Brathwaite Natasha
Bought by
Crawford Mildred
Current Estimated Value
Home Financials for this Owner
Home Financials are based on the most recent Mortgage that was taken out on this home.
Original Mortgage
$79,543
Outstanding Balance
$52,335
Interest Rate
5.47%
Mortgage Type
Purchase Money Mortgage
Estimated Equity
$191,757
Purchase Details
Closed on
Feb 24, 2005
Sold by
Devine Mgmt & Rlty
Bought by
Stewart Kwame D
Home Financials for this Owner
Home Financials are based on the most recent Mortgage that was taken out on this home.
Original Mortgage
$126,000
Interest Rate
7.99%
Mortgage Type
Purchase Money Mortgage
Purchase Details
Closed on
Nov 25, 2003
Sold by
Vanburen Evelyn and Fishman Douglas
Bought by
Browdy John
Create a Home Valuation Report for This Property
The Home Valuation Report is an in-depth analysis detailing your home's value as well as a comparison with similar homes in the area
Home Values in the Area
Average Home Value in this Area
Purchase History
| Date | Buyer | Sale Price | Title Company |
|---|---|---|---|
| Crawford Mildred | $85,000 | -- | |
| Stewart Kwame D | $140,000 | -- | |
| Browdy John | $105,000 | -- |
Source: Public Records
Mortgage History
| Date | Status | Borrower | Loan Amount |
|---|---|---|---|
| Open | Browdy John | $79,543 | |
| Closed | Browdy John | $8,950 | |
| Previous Owner | Browdy John | $23,550 | |
| Previous Owner | Browdy John | $126,000 |
Source: Public Records
Tax History Compared to Growth
Tax History
| Year | Tax Paid | Tax Assessment Tax Assessment Total Assessment is a certain percentage of the fair market value that is determined by local assessors to be the total taxable value of land and additions on the property. | Land | Improvement |
|---|---|---|---|---|
| 2025 | $3,307 | $47,959 | $6,395 | $41,564 |
| 2024 | $3,307 | $47,959 | $6,395 | $41,564 |
| 2023 | $3,307 | $47,959 | $6,395 | $41,564 |
| 2022 | $3,307 | $47,959 | $6,395 | $41,564 |
| 2021 | $2,663 | $35,840 | $7,560 | $28,280 |
| 2020 | $2,663 | $35,840 | $7,560 | $28,280 |
| 2019 | $2,663 | $35,840 | $7,560 | $28,280 |
| 2018 | $2,573 | $34,632 | $7,305 | $27,327 |
| 2016 | $2,718 | $36,591 | $6,958 | $29,633 |
| 2015 | $2,589 | $34,852 | $6,626 | $28,226 |
| 2014 | $2,526 | $34,000 | $6,464 | $27,536 |
Source: Public Records
Map
Nearby Homes
- 218 Holcomb St Unit 220
- 211 Holcomb St Unit 213
- 355 Cornwall St Unit 357
- 90 Manchester St
- 179 Manchester St
- 157 Pembroke St Unit 159
- 144 Thomaston St
- 86 Hartland St
- 11 Pershing St Unit 13
- 10 Baltic St Unit 12
- 36 Baltic St Unit 38
- 70 Burnham St Unit 72
- 152 Burnham St
- 25 Cornwall St
- 111 Westbourne Pkwy Unit 113
- 125 Lebanon St Unit 127
- 181 Westbourne Pkwy
- 147 Morningside St W
- 171 N Canaan St
- 109 Blue Hills Ave
- 82 Andover St
- 92 Andover St
- 96 Andover St
- 78 Andover St
- 93 Westminster St
- 87 Westminster St
- 99 Westminster St
- 83 Westminster St
- 72 Andover St
- 102 Andover St
- 103 Westminster St
- 79 Westminster St
- 106 Andover St
- 109 Westminster St
- 68 Andover St
- 73 Westminster St
- 112 Andover St
- 115 Westminster St
- 92 Westminster St
- 96 Westminster St