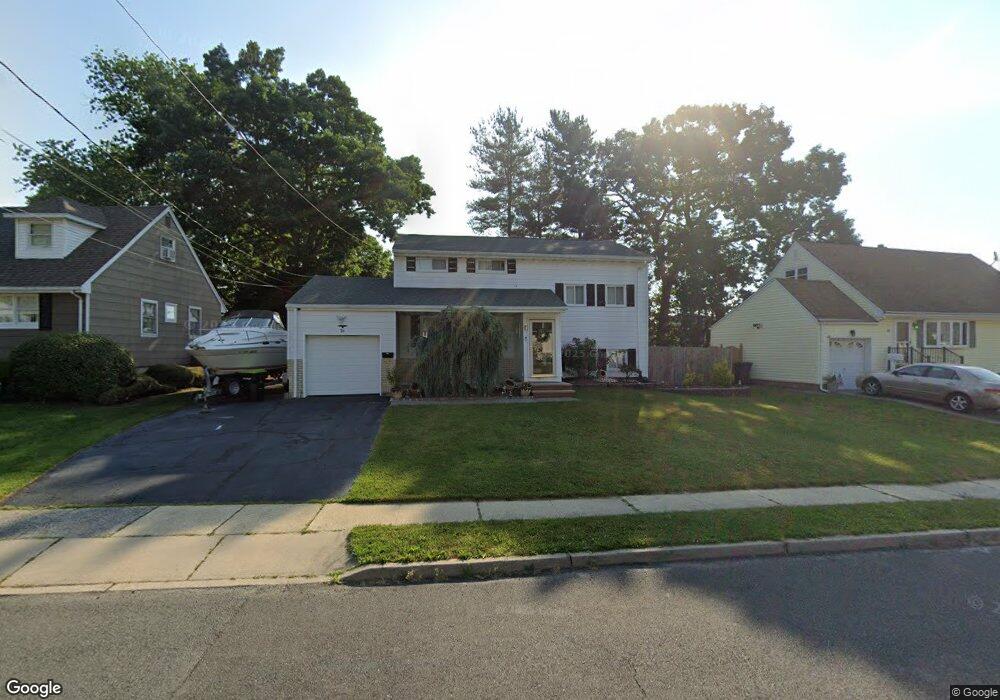
86 Athens Ave South Amboy, NJ 08879
Estimated Value: $583,134 - $663,000
4
Beds
2
Baths
1,800
Sq Ft
$347/Sq Ft
Est. Value
About This Home
This home is located at 86 Athens Ave, South Amboy, NJ 08879 and is currently estimated at $624,784, approximately $347 per square foot. 86 Athens Ave is a home located in Middlesex County with nearby schools including Old Bridge High School, Minding Miracles Learning Center, and Matawan Montessori Academy.
Ownership History
Date
Name
Owned For
Owner Type
Purchase Details
Closed on
Nov 10, 2017
Sold by
Chan Edward K and Fung Chan Sandy Kam
Bought by
Simoes Nelson and Caccamo Ana
Current Estimated Value
Home Financials for this Owner
Home Financials are based on the most recent Mortgage that was taken out on this home.
Original Mortgage
$234,850
Interest Rate
3.99%
Mortgage Type
New Conventional
Purchase Details
Closed on
Mar 30, 1989
Bought by
Chan Edward and Kam Fung, Sandy
Create a Home Valuation Report for This Property
The Home Valuation Report is an in-depth analysis detailing your home's value as well as a comparison with similar homes in the area
Home Values in the Area
Average Home Value in this Area
Purchase History
| Date | Buyer | Sale Price | Title Company |
|---|---|---|---|
| Simoes Nelson | $305,000 | Fidelity Natl Title Ins Co | |
| Chan Edward | $172,000 | -- |
Source: Public Records
Mortgage History
| Date | Status | Borrower | Loan Amount |
|---|---|---|---|
| Previous Owner | Simoes Nelson | $234,850 |
Source: Public Records
Tax History Compared to Growth
Tax History
| Year | Tax Paid | Tax Assessment Tax Assessment Total Assessment is a certain percentage of the fair market value that is determined by local assessors to be the total taxable value of land and additions on the property. | Land | Improvement |
|---|---|---|---|---|
| 2025 | $8,013 | $139,400 | $56,000 | $83,400 |
| 2024 | $7,698 | $139,400 | $56,000 | $83,400 |
| 2023 | $7,698 | $139,400 | $56,000 | $83,400 |
| 2022 | $7,459 | $139,400 | $56,000 | $83,400 |
| 2021 | $5,480 | $139,400 | $56,000 | $83,400 |
| 2020 | $7,247 | $139,400 | $56,000 | $83,400 |
| 2019 | $7,136 | $139,400 | $56,000 | $83,400 |
| 2018 | $7,049 | $139,400 | $56,000 | $83,400 |
| 2017 | $6,833 | $139,400 | $56,000 | $83,400 |
| 2016 | $6,694 | $139,400 | $56,000 | $83,400 |
| 2015 | $6,581 | $139,400 | $56,000 | $83,400 |
| 2014 | $6,513 | $139,400 | $56,000 | $83,400 |
Source: Public Records
Map
Nearby Homes