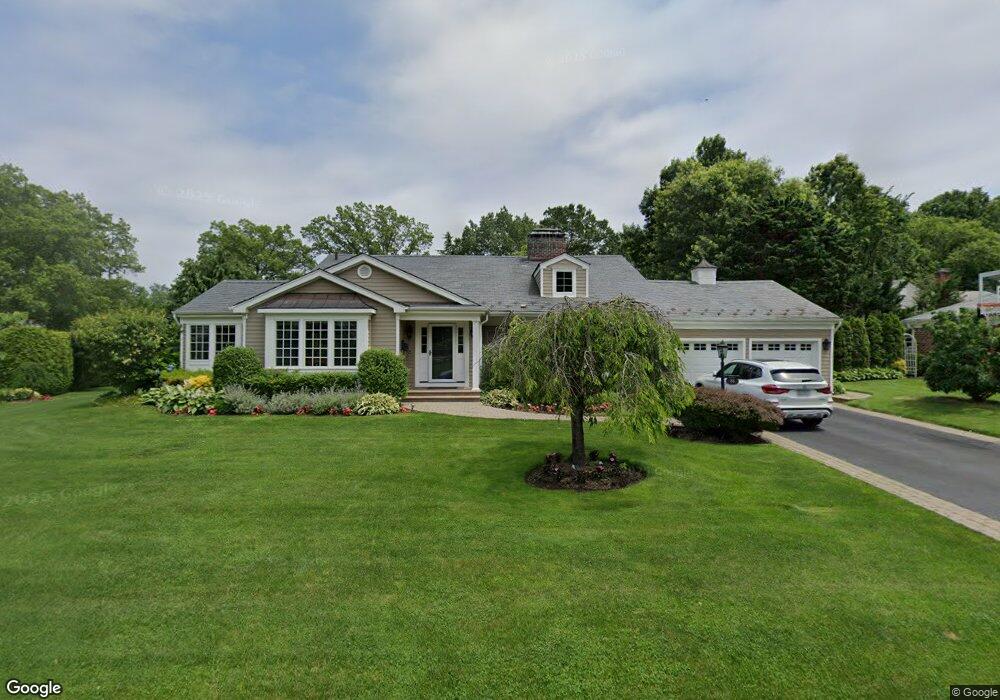
86 Bartlett Dr Manhasset, NY 11030
Estimated Value: $2,296,071 - $2,703,000
Studio
3
Baths
2,103
Sq Ft
$1,189/Sq Ft
Est. Value
About This Home
This home is located at 86 Bartlett Dr, Manhasset, NY 11030 and is currently estimated at $2,499,536, approximately $1,188 per square foot. 86 Bartlett Dr is a home located in Nassau County with nearby schools including Manhasset Secondary School, St Mary's Elementary School, and St. Mary's College Preparatory High School.
Ownership History
Date
Name
Owned For
Owner Type
Purchase Details
Closed on
Nov 16, 2013
Sold by
Ladopoulos Paul and Ladopoulos Linda
Bought by
Ladopoulos Linda
Current Estimated Value
Purchase Details
Closed on
Aug 3, 2010
Sold by
Waxman Michele
Bought by
Ladopoulos Paul and Ladopoulos Linda
Home Financials for this Owner
Home Financials are based on the most recent Mortgage that was taken out on this home.
Original Mortgage
$729,000
Interest Rate
4.05%
Mortgage Type
Purchase Money Mortgage
Purchase Details
Closed on
Jun 26, 2009
Sold by
Waxman Eugene and Waxman Michele
Bought by
Waxman Michele
Purchase Details
Closed on
Aug 8, 2001
Sold by
Aliprantis Peter
Bought by
Waxman Eugene
Purchase Details
Closed on
Dec 1, 1998
Sold by
Pellegrino Camille
Bought by
Aliprantis Peter and Aliprantis Maria
Create a Home Valuation Report for This Property
The Home Valuation Report is an in-depth analysis detailing your home's value as well as a comparison with similar homes in the area
Home Values in the Area
Average Home Value in this Area
Purchase History
| Date | Buyer | Sale Price | Title Company |
|---|---|---|---|
| Ladopoulos Linda | -- | -- | |
| Ladopoulos Linda | -- | -- | |
| Ladopoulos Linda | -- | -- | |
| Ladopoulos Paul | $1,230,000 | -- | |
| Ladopoulos Paul | $1,230,000 | -- | |
| Ladopoulos Paul | $1,230,000 | -- | |
| Ladopoulos Paul | $1,230,000 | -- | |
| Waxman Michele | -- | -- | |
| Waxman Michele | -- | -- | |
| Waxman Michele | -- | -- | |
| Waxman Eugene | $845,000 | Anthony Piaeataini | |
| Waxman Eugene | $845,000 | Anthony Piaeataini | |
| Aliprantis Peter | $597,000 | -- | |
| Aliprantis Peter | $597,000 | -- |
Source: Public Records
Mortgage History
| Date | Status | Borrower | Loan Amount |
|---|---|---|---|
| Previous Owner | Ladopoulos Paul | $729,000 |
Source: Public Records
Tax History
| Year | Tax Paid | Tax Assessment Tax Assessment Total Assessment is a certain percentage of the fair market value that is determined by local assessors to be the total taxable value of land and additions on the property. | Land | Improvement |
|---|---|---|---|---|
| 2025 | $21,920 | $1,441 | $838 | $603 |
| 2024 | $6,099 | $1,520 | $884 | $636 |
Source: Public Records
Map
Nearby Homes
- 12 Knollwood Rd
- 84 Middle Neck Rd
- 265 Northwoods Rd
- 32 Barnard Place
- 409 Abbey Rd
- 448 Abbey Rd N
- 97 Crabapple Rd
- 4 Peachtree Ln
- 126 Northwoods Rd
- 26 Birchdale Ln
- 16 Ridge Dr E
- 19 Ridge Dr E
- 38 Hewlett Ln
- 225 Port Washington Blvd
- 40 Hewlett Ln
- 220 Elderfields Rd
- 26 the Hemlocks
- 17 Tatterson St
- 52 Woodland Rd
- 91 Fernwood Ln
Your Personal Tour Guide
Ask me questions while you tour the home.