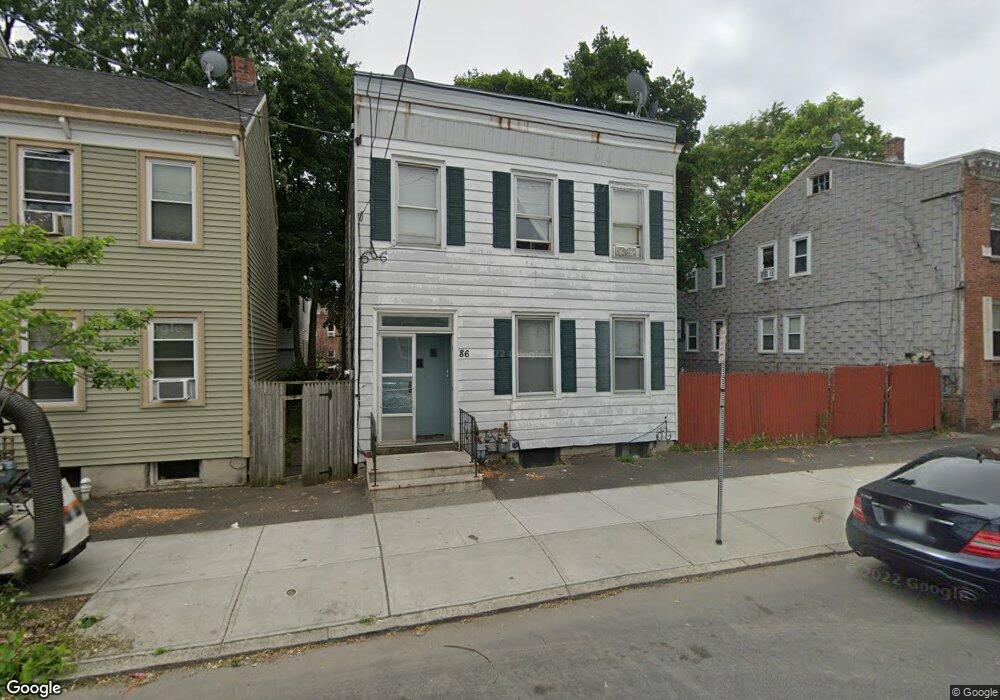
86 Bradford St Albany, NY 12206
West Hill NeighborhoodEstimated Value: $181,000 - $350,000
3
Beds
2
Baths
1,472
Sq Ft
$159/Sq Ft
Est. Value
About This Home
This home is located at 86 Bradford St, Albany, NY 12206 and is currently estimated at $234,291, approximately $159 per square foot. 86 Bradford St is a home located in Albany County with nearby schools including Sheridan Preparatory Academy, Stephen And Harriet Myers Middle School, and Albany High School.
Ownership History
Date
Name
Owned For
Owner Type
Purchase Details
Closed on
Sep 16, 2011
Sold by
Raftery Debra
Bought by
Livingstone Arbor Hill Llc
Current Estimated Value
Purchase Details
Closed on
Aug 22, 2002
Sold by
Secretary Of Housing & Urban Development
Bought by
Raftory Debra
Purchase Details
Closed on
Nov 20, 2001
Purchase Details
Closed on
Feb 4, 2000
Sold by
Star Improvement Inc
Bought by
Clark Earl
Purchase Details
Closed on
Feb 1, 1999
Sold by
Hendrie Constance
Bought by
Star Improvements Inc
Create a Home Valuation Report for This Property
The Home Valuation Report is an in-depth analysis detailing your home's value as well as a comparison with similar homes in the area
Home Values in the Area
Average Home Value in this Area
Purchase History
| Date | Buyer | Sale Price | Title Company |
|---|---|---|---|
| Livingstone Arbor Hill Llc | $47,500 | None Available | |
| Raftory Debra | $29,575 | Robert Randall | |
| -- | $58,181 | -- | |
| Clark Earl | $60,000 | -- | |
| Star Improvements Inc | $10,000 | -- | |
| Star Improvement Inc | $22,500 | -- |
Source: Public Records
Tax History Compared to Growth
Tax History
| Year | Tax Paid | Tax Assessment Tax Assessment Total Assessment is a certain percentage of the fair market value that is determined by local assessors to be the total taxable value of land and additions on the property. | Land | Improvement |
|---|---|---|---|---|
| 2024 | $4,110 | $154,000 | $30,800 | $123,200 |
| 2023 | $1,954 | $45,000 | $9,000 | $36,000 |
| 2022 | $1,914 | $45,000 | $9,000 | $36,000 |
| 2021 | $1,910 | $45,000 | $9,000 | $36,000 |
| 2020 | $1,707 | $45,000 | $9,000 | $36,000 |
| 2019 | $1,772 | $45,000 | $9,000 | $36,000 |
| 2018 | $1,711 | $45,000 | $9,000 | $36,000 |
| 2017 | $653 | $45,000 | $9,000 | $36,000 |
| 2016 | $1,660 | $45,000 | $9,000 | $36,000 |
| 2015 | $1,743 | $47,500 | $16,100 | $31,400 |
| 2014 | -- | $47,500 | $16,100 | $31,400 |
Source: Public Records
Map
Nearby Homes