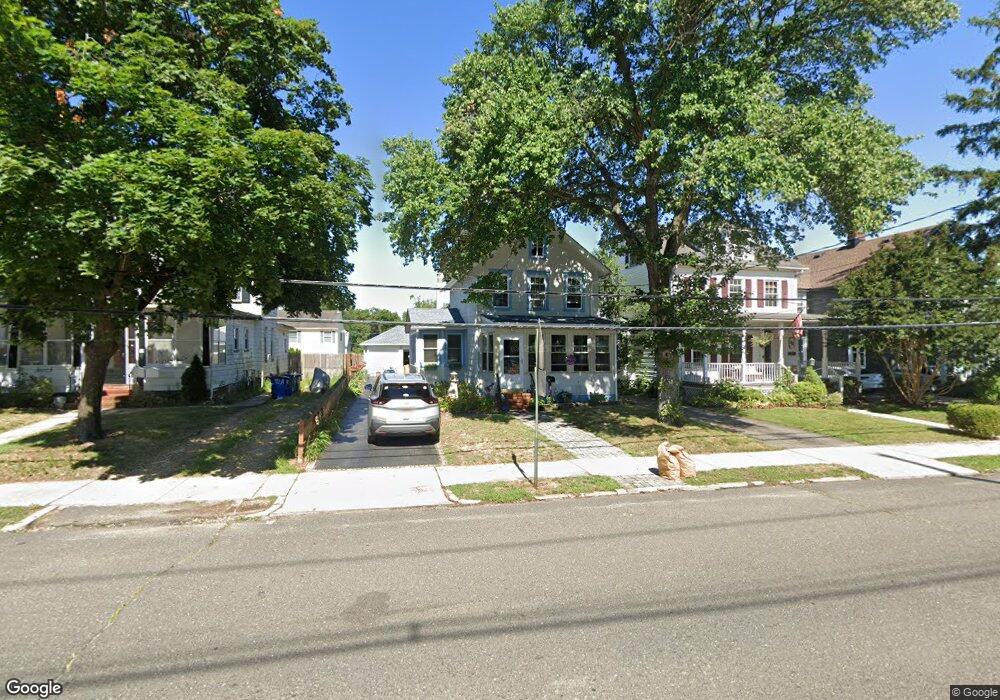
86 Broadway Keyport, NJ 07735
Estimated Value: $420,000 - $517,000
2
Beds
1
Bath
1,200
Sq Ft
$382/Sq Ft
Est. Value
About This Home
This home is located at 86 Broadway, Keyport, NJ 07735 and is currently estimated at $458,985, approximately $382 per square foot. 86 Broadway is a home located in Monmouth County with nearby schools including Keyport Central School, Keyport High School, and Icob Academy.
Ownership History
Date
Name
Owned For
Owner Type
Purchase Details
Closed on
Sep 29, 2009
Sold by
Burns James D
Bought by
Smith John F and Smith Ann E
Current Estimated Value
Home Financials for this Owner
Home Financials are based on the most recent Mortgage that was taken out on this home.
Original Mortgage
$193,150
Interest Rate
4.92%
Mortgage Type
VA
Purchase Details
Closed on
Aug 1, 2006
Sold by
Donofrio Mary
Bought by
Burns James D
Home Financials for this Owner
Home Financials are based on the most recent Mortgage that was taken out on this home.
Original Mortgage
$205,600
Interest Rate
6.88%
Mortgage Type
New Conventional
Create a Home Valuation Report for This Property
The Home Valuation Report is an in-depth analysis detailing your home's value as well as a comparison with similar homes in the area
Home Values in the Area
Average Home Value in this Area
Purchase History
| Date | Buyer | Sale Price | Title Company |
|---|---|---|---|
| Smith John F | $212,000 | Fidelity Natl Title Ins Co | |
| Burns James D | $257,000 | -- |
Source: Public Records
Mortgage History
| Date | Status | Borrower | Loan Amount |
|---|---|---|---|
| Previous Owner | Smith John F | $193,150 | |
| Previous Owner | Burns James D | $205,600 |
Source: Public Records
Tax History Compared to Growth
Tax History
| Year | Tax Paid | Tax Assessment Tax Assessment Total Assessment is a certain percentage of the fair market value that is determined by local assessors to be the total taxable value of land and additions on the property. | Land | Improvement |
|---|---|---|---|---|
| 2025 | $7,152 | $379,300 | $186,100 | $193,200 |
| 2024 | $7,045 | $345,500 | $161,800 | $183,700 |
| 2023 | $7,045 | $320,500 | $147,100 | $173,400 |
| 2022 | $6,153 | $278,600 | $127,900 | $150,700 |
| 2021 | $6,153 | $253,700 | $118,400 | $135,300 |
| 2020 | $6,055 | $238,100 | $109,400 | $128,700 |
| 2019 | $5,741 | $226,100 | $100,400 | $125,700 |
| 2018 | $5,668 | $218,000 | $100,400 | $117,600 |
| 2017 | $5,647 | $216,600 | $100,400 | $116,200 |
| 2016 | $5,447 | $210,700 | $100,400 | $110,300 |
| 2015 | $5,900 | $227,200 | $118,400 | $108,800 |
| 2014 | $5,671 | $220,500 | $100,400 | $120,100 |
Source: Public Records
Map
Nearby Homes
- 95 Broadway
- 8 Chingarora Ave
- 127 Chingarora Ave
- 253 Broadway
- 1 Hobart St
- 52 Highway 35
- 9 Monmouth Place
- 324 Maple Place
- 369 Riverdale Dr
- 55 E Front St
- 40 Church St
- 226 Osborn St
- 22 Lower Main St
- 910 Malden Dr
- 90 Saint Peters Place
- 358 Shadynook St
- 345 Shadynook St
- 195 Atlantic St
- 811 Shore Concourse
- 128 1st St
- 82 Broadway
- 92 Broadway
- 92 Broadway Unit B
- 92 Broadway Unit A
- 78 Broadway
- 96 Broadway
- 67 Washington St
- 20 W 2nd St
- 91 Broadway Unit T
- 71 Washington St
- 69 Washington St
- 104 Broadway
- 70 Broadway
- 70 Broadway Unit 2
- 70 Broadway Unit 3
- 70 Broadway Unit 1
- 93 Broadway
- 77 Washington St
- 75 Broadway Unit Upstairs
- 75 Broadway