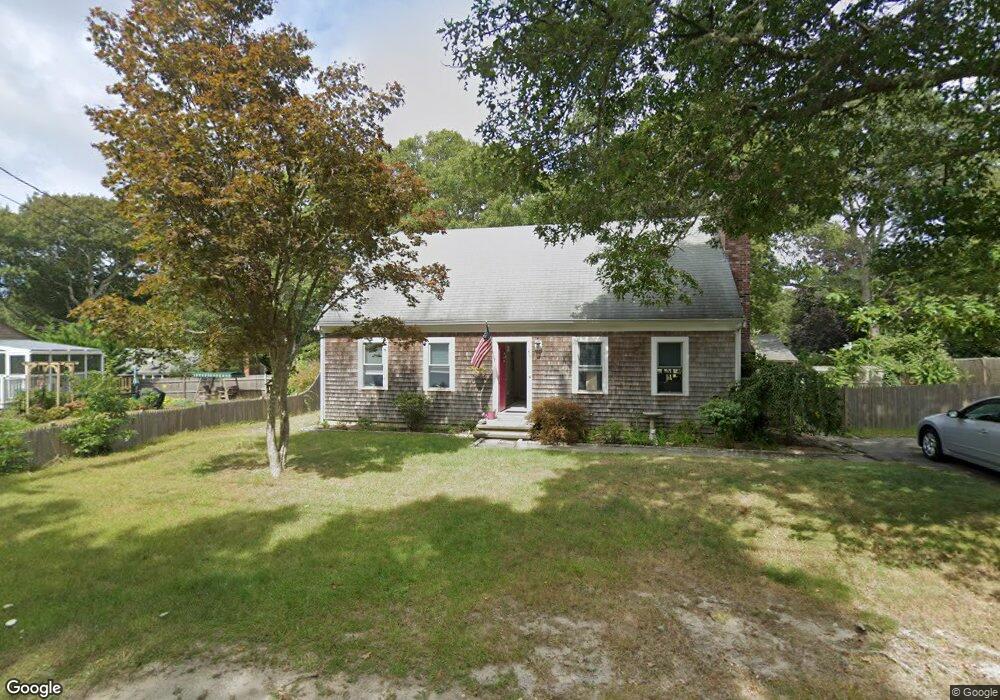
86 Charles St South Dennis, MA 02660
South Dennis NeighborhoodEstimated Value: $617,000 - $738,000
3
Beds
1
Bath
800
Sq Ft
$840/Sq Ft
Est. Value
About This Home
This home is located at 86 Charles St, South Dennis, MA 02660 and is currently estimated at $672,245, approximately $840 per square foot. 86 Charles St is a home located in Barnstable County with nearby schools including Dennis-Yarmouth Regional High School and St. Pius X. School.
Ownership History
Date
Name
Owned For
Owner Type
Purchase Details
Closed on
Sep 3, 1998
Sold by
Jones Muriel M
Bought by
Stewart James S and Stewart Marijah C
Current Estimated Value
Home Financials for this Owner
Home Financials are based on the most recent Mortgage that was taken out on this home.
Original Mortgage
$66,750
Outstanding Balance
$14,259
Interest Rate
6.9%
Mortgage Type
Purchase Money Mortgage
Estimated Equity
$657,986
Create a Home Valuation Report for This Property
The Home Valuation Report is an in-depth analysis detailing your home's value as well as a comparison with similar homes in the area
Home Values in the Area
Average Home Value in this Area
Purchase History
| Date | Buyer | Sale Price | Title Company |
|---|---|---|---|
| Stewart James S | $89,000 | -- |
Source: Public Records
Mortgage History
| Date | Status | Borrower | Loan Amount |
|---|---|---|---|
| Open | Stewart James S | $66,750 | |
| Closed | Stewart James S | $17,800 |
Source: Public Records
Tax History Compared to Growth
Tax History
| Year | Tax Paid | Tax Assessment Tax Assessment Total Assessment is a certain percentage of the fair market value that is determined by local assessors to be the total taxable value of land and additions on the property. | Land | Improvement |
|---|---|---|---|---|
| 2025 | $2,550 | $588,800 | $130,000 | $458,800 |
| 2024 | $2,415 | $550,200 | $125,000 | $425,200 |
| 2023 | $2,357 | $504,800 | $113,600 | $391,200 |
| 2022 | $2,286 | $408,300 | $113,800 | $294,500 |
| 2021 | $2,096 | $347,600 | $111,500 | $236,100 |
| 2020 | $2,053 | $336,600 | $111,500 | $225,100 |
| 2019 | $1,994 | $323,200 | $120,300 | $202,900 |
| 2018 | $1,901 | $299,800 | $104,100 | $195,700 |
| 2017 | $1,844 | $299,800 | $104,100 | $195,700 |
| 2016 | $1,800 | $275,700 | $109,300 | $166,400 |
| 2015 | $1,764 | $275,700 | $109,300 | $166,400 |
| 2014 | $1,596 | $251,400 | $93,700 | $157,700 |
Source: Public Records
Map
Nearby Homes
- 153 Bayridge Dr
- 17 Margate Ln
- 15 Captain Jud Rd
- 4 Ebb Rd
- 10 Joanne Dr
- 17 Fairmount Rd
- 17 Fairmount Rd
- 13 Covey Dr
- 118 Driftwood Ln
- 25 Skerry Rd
- 7 Vinland Dr
- 129 Driftwood Ln
- 111 Merchant Ave
- 1 Norseman Dr
- 32 Captain Walsh Dr
- 62 Old Fish House Rd
- 6 Hawthorn St
- 6 Nimble Hill Dr
- 4 Old Colony Way
- 59 Main St Unit 19-2