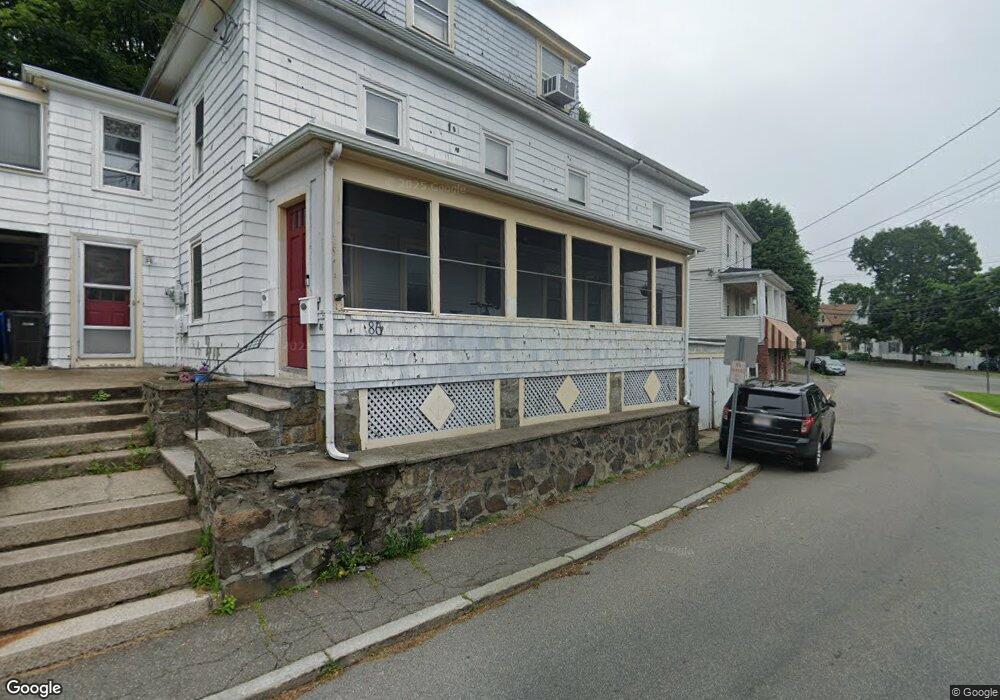
86 Cherry St Unit 1 Swampscott, MA 01907
Estimated Value: $695,430 - $834,000
2
Beds
1
Bath
1,000
Sq Ft
$766/Sq Ft
Est. Value
About This Home
This home is located at 86 Cherry St Unit 1, Swampscott, MA 01907 and is currently estimated at $765,608, approximately $765 per square foot. 86 Cherry St Unit 1 is a home located in Essex County with nearby schools including Swampscott Middle School and Swampscott High School.
Ownership History
Date
Name
Owned For
Owner Type
Purchase Details
Closed on
Jul 11, 2025
Sold by
Bui Eva B
Bought by
Eva Bui Lt Of 2025 and Bui
Current Estimated Value
Purchase Details
Closed on
Jul 29, 2020
Sold by
Jays Home Improvement Llc
Bought by
Bich-Bui Eva
Home Financials for this Owner
Home Financials are based on the most recent Mortgage that was taken out on this home.
Original Mortgage
$312,000
Interest Rate
4.63%
Mortgage Type
Adjustable Rate Mortgage/ARM
Purchase Details
Closed on
Jan 4, 2019
Sold by
Dp Homes Llc
Bought by
Jays Home Improvement Llc
Purchase Details
Closed on
Oct 16, 2017
Sold by
Holmes Betty and Dean Marcia
Bought by
Dp Homes Llc
Purchase Details
Closed on
Apr 2, 2010
Sold by
Holmes Andrew B and Holmes Betty
Bought by
Holmes Betty
Create a Home Valuation Report for This Property
The Home Valuation Report is an in-depth analysis detailing your home's value as well as a comparison with similar homes in the area
Home Values in the Area
Average Home Value in this Area
Purchase History
| Date | Buyer | Sale Price | Title Company |
|---|---|---|---|
| Eva Bui Lt Of 2025 | -- | -- | |
| Eva Bui Lt Of 2025 | -- | -- | |
| Eva Bui Lt Of 2025 | -- | -- | |
| Bich-Bui Eva | -- | None Available | |
| Bich-Bui Eva | -- | None Available | |
| Jays Home Improvement Llc | $415,000 | -- | |
| Jays Home Improvement Llc | $415,000 | -- | |
| Jays Home Improvement Llc | $415,000 | -- | |
| Dp Homes Llc | $390,000 | -- | |
| Dp Homes Llc | $390,000 | -- | |
| Holmes Betty | -- | -- | |
| Holmes Betty | -- | -- |
Source: Public Records
Mortgage History
| Date | Status | Borrower | Loan Amount |
|---|---|---|---|
| Previous Owner | Bich-Bui Eva | $312,000 |
Source: Public Records
Tax History
| Year | Tax Paid | Tax Assessment Tax Assessment Total Assessment is a certain percentage of the fair market value that is determined by local assessors to be the total taxable value of land and additions on the property. | Land | Improvement |
|---|---|---|---|---|
| 2025 | $7,337 | $639,700 | $270,700 | $369,000 |
| 2024 | $7,196 | $626,300 | $257,800 | $368,500 |
| 2023 | $7,010 | $597,100 | $238,700 | $358,400 |
| 2022 | $6,935 | $540,500 | $200,500 | $340,000 |
| 2021 | $6,625 | $480,100 | $171,900 | $308,200 |
| 2020 | $5,834 | $408,000 | $152,800 | $255,200 |
| 2019 | $5,911 | $388,900 | $133,700 | $255,200 |
| 2018 | $5,950 | $371,900 | $124,100 | $247,800 |
| 2017 | $5,614 | $321,700 | $90,700 | $231,000 |
| 2016 | $5,161 | $297,800 | $77,400 | $220,400 |
| 2015 | $5,107 | $297,800 | $77,400 | $220,400 |
| 2014 | $5,243 | $280,400 | $77,400 | $203,000 |
Source: Public Records
Map
Nearby Homes
- 4 Valley Rd Unit 4
- 40 Buena Vista St
- 80 Norfolk Ave Unit 1
- 106 Norfolk Ave
- 60 Roy St
- 46 Stetson Ave
- 59 Essex St Unit 59B
- 146 Burrill St
- 64 Stetson Ave
- 11 Boynton St Unit 104
- 11 Boynton St Unit 101
- 11 Boynton St Unit 103
- 11 Boynton St Unit 204
- 16 Isabella St
- 178 Norfolk Ave
- 108-110 Burrill St Unit 1
- 40 Archer St
- 97 Seymour Ave
- 28 Claremont Terrace Unit 6
- 32 Kings Beach Terrace
- 86 Cherry St
- 62 Essex St
- 88 Cherry St
- 58 Essex St
- 56 Essex St Unit 56
- 74 Essex St
- 54 Essex St
- 27 Spinale Rd Unit A
- 27 Spinale Rd Unit B
- 65 Essex St
- 69 Essex St
- 63 Essex St
- 63 Essex St Unit 1
- 71 Essex St
- 50 Essex St
- 50 Essex St Unit 3
- 50 Essex St Unit 2
- 50 Essex St Unit 1
- 50 Essex St Unit 56
- 27 Spinale Rd
Your Personal Tour Guide
Ask me questions while you tour the home.