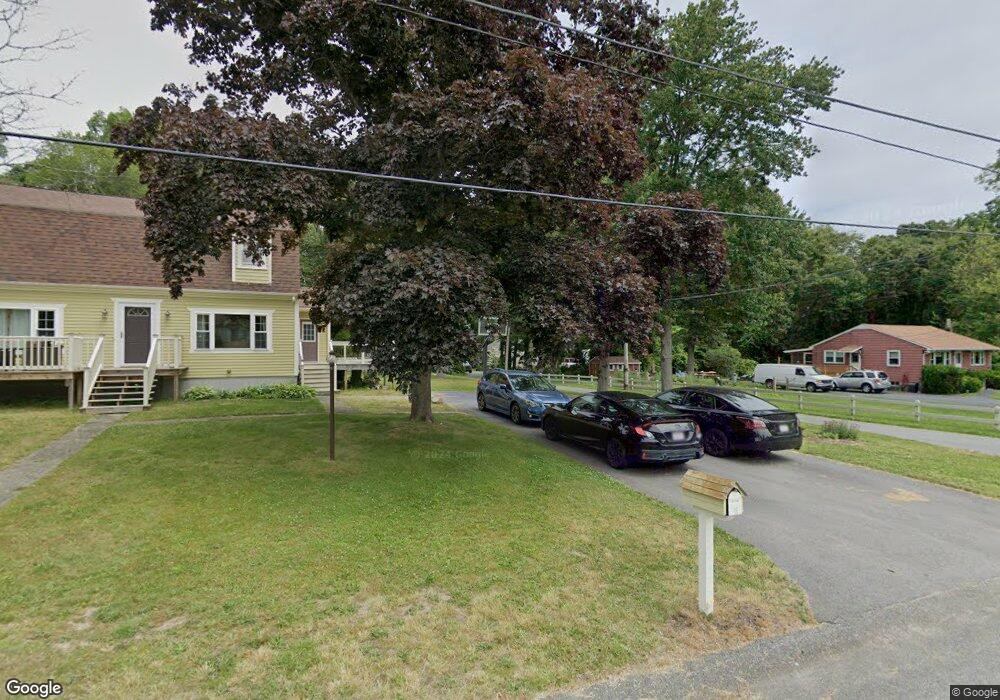
86 Conscript Ave Westport, MA 02790
North Westport NeighborhoodEstimated Value: $456,000 - $519,000
3
Beds
--
Bath
1,336
Sq Ft
$368/Sq Ft
Est. Value
About This Home
This home is located at 86 Conscript Ave, Westport, MA 02790 and is currently estimated at $491,253, approximately $367 per square foot. 86 Conscript Ave is a home located in Bristol County with nearby schools including Alice A. Macomber Primary School, Westport Elementary School, and Westport Middle-High School.
Ownership History
Date
Name
Owned For
Owner Type
Purchase Details
Closed on
Dec 24, 2007
Sold by
Narciso Mark A
Bought by
Narciso Donna and Narciso Mark A
Current Estimated Value
Purchase Details
Closed on
Mar 28, 2005
Sold by
Narciso Mark A and Narciso Maryann B
Bought by
Narciso Mark A
Home Financials for this Owner
Home Financials are based on the most recent Mortgage that was taken out on this home.
Original Mortgage
$180,000
Interest Rate
5.56%
Mortgage Type
Purchase Money Mortgage
Create a Home Valuation Report for This Property
The Home Valuation Report is an in-depth analysis detailing your home's value as well as a comparison with similar homes in the area
Home Values in the Area
Average Home Value in this Area
Purchase History
| Date | Buyer | Sale Price | Title Company |
|---|---|---|---|
| Narciso Donna | -- | -- | |
| Narciso Mark A | -- | -- |
Source: Public Records
Mortgage History
| Date | Status | Borrower | Loan Amount |
|---|---|---|---|
| Open | Narciso Mark A | $172,000 | |
| Previous Owner | Narciso Mark A | $33,000 | |
| Previous Owner | Narciso Mark A | $180,000 |
Source: Public Records
Tax History Compared to Growth
Tax History
| Year | Tax Paid | Tax Assessment Tax Assessment Total Assessment is a certain percentage of the fair market value that is determined by local assessors to be the total taxable value of land and additions on the property. | Land | Improvement |
|---|---|---|---|---|
| 2025 | $2,857 | $383,500 | $150,000 | $233,500 |
| 2024 | $2,852 | $369,000 | $138,900 | $230,100 |
| 2023 | $2,667 | $326,800 | $126,000 | $200,800 |
| 2022 | $2,569 | $302,900 | $119,700 | $183,200 |
| 2021 | $2,515 | $291,800 | $108,800 | $183,000 |
| 2020 | $2,377 | $282,000 | $99,000 | $183,000 |
| 2019 | $2,235 | $270,300 | $99,000 | $171,300 |
| 2018 | $1,818 | $222,500 | $86,200 | $136,300 |
| 2017 | $1,765 | $221,500 | $92,100 | $129,400 |
| 2016 | $1,677 | $212,000 | $87,400 | $124,600 |
| 2015 | $1,773 | $223,600 | $100,400 | $123,200 |
Source: Public Records
Map
Nearby Homes