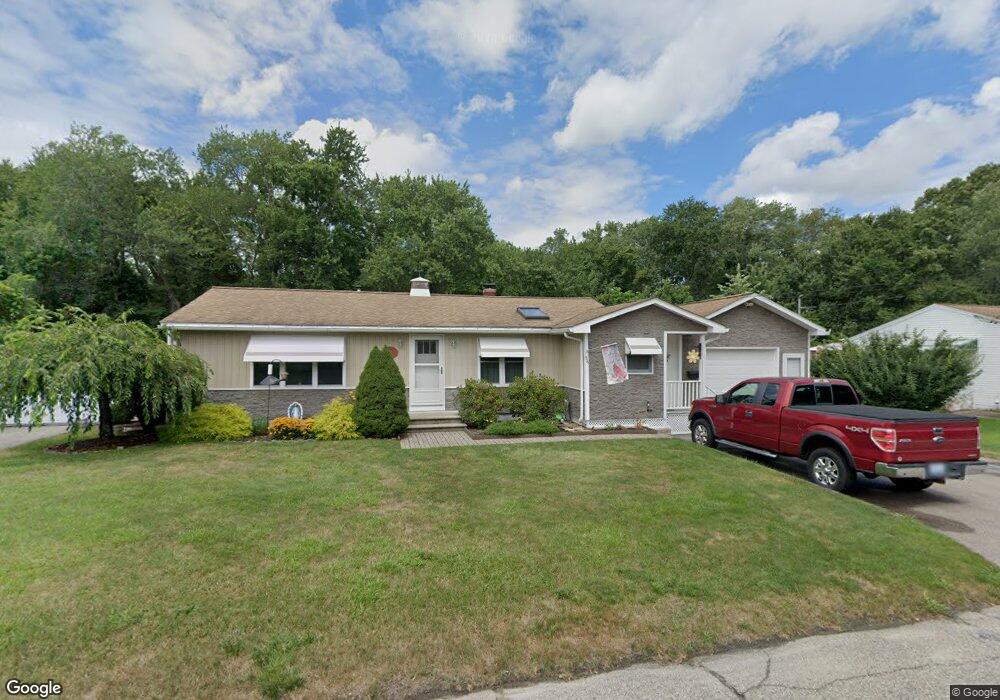
86 Denby St Woonsocket, RI 02895
East Woonsocket NeighborhoodEstimated Value: $399,448 - $429,000
2
Beds
1
Bath
1,110
Sq Ft
$374/Sq Ft
Est. Value
About This Home
This home is located at 86 Denby St, Woonsocket, RI 02895 and is currently estimated at $414,612, approximately $373 per square foot. 86 Denby St is a home located in Providence County with nearby schools including Woonsocket High School, Rise Prep Mayoral Academy Middle School, and Rise Prep Mayoral Academy.
Ownership History
Date
Name
Owned For
Owner Type
Purchase Details
Closed on
Mar 12, 2018
Sold by
Houle Roger P and Houle Elise I
Bought by
Roger P Houle T P and Roger Houle
Current Estimated Value
Purchase Details
Closed on
Feb 6, 2018
Sold by
Houle Roger P and Houle Elies I
Bought by
Roger P Houle T P and Roger Houle
Purchase Details
Closed on
Jan 1, 1987
Bought by
Houle Roger P and Houle Elise I
Create a Home Valuation Report for This Property
The Home Valuation Report is an in-depth analysis detailing your home's value as well as a comparison with similar homes in the area
Home Values in the Area
Average Home Value in this Area
Purchase History
| Date | Buyer | Sale Price | Title Company |
|---|---|---|---|
| Roger P Houle T P | -- | -- | |
| Roger P Houle T P | -- | -- | |
| Houle Roger P | -- | -- | |
| Roger P Houle T P | -- | -- | |
| Roger P Houle T P | -- | -- |
Source: Public Records
Mortgage History
| Date | Status | Borrower | Loan Amount |
|---|---|---|---|
| Previous Owner | Houle Roger P | $108,000 |
Source: Public Records
Tax History Compared to Growth
Tax History
| Year | Tax Paid | Tax Assessment Tax Assessment Total Assessment is a certain percentage of the fair market value that is determined by local assessors to be the total taxable value of land and additions on the property. | Land | Improvement |
|---|---|---|---|---|
| 2025 | $4,710 | $419,400 | $102,300 | $317,100 |
| 2024 | $4,317 | $296,900 | $97,100 | $199,800 |
| 2023 | $4,151 | $296,900 | $97,100 | $199,800 |
| 2022 | $4,151 | $296,900 | $97,100 | $199,800 |
| 2021 | $4,631 | $195,000 | $65,600 | $129,400 |
| 2020 | $4,680 | $195,000 | $65,600 | $129,400 |
| 2018 | $4,696 | $195,000 | $65,600 | $129,400 |
| 2017 | $4,635 | $154,000 | $57,100 | $96,900 |
| 2016 | $4,903 | $154,000 | $57,100 | $96,900 |
| 2015 | $5,633 | $154,000 | $57,100 | $96,900 |
| 2014 | $4,146 | $164,800 | $62,800 | $102,000 |
Source: Public Records
Map
Nearby Homes