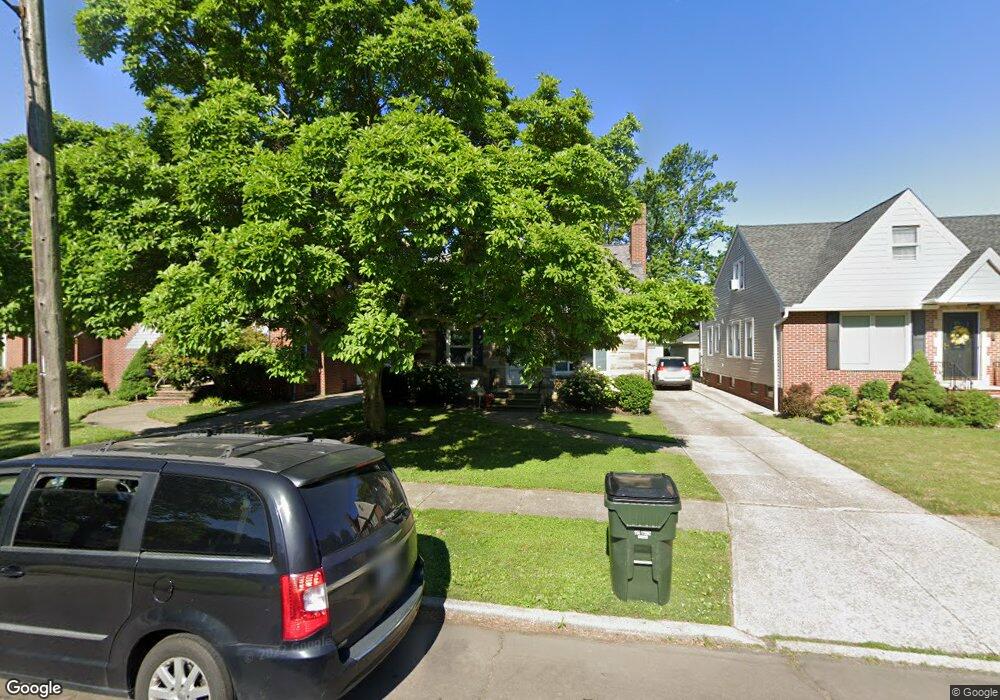
86 E 267th St Euclid, OH 44132
Estimated Value: $165,000 - $214,000
3
Beds
1
Bath
1,575
Sq Ft
$117/Sq Ft
Est. Value
About This Home
This home is located at 86 E 267th St, Euclid, OH 44132 and is currently estimated at $183,734, approximately $116 per square foot. 86 E 267th St is a home with nearby schools including Shoreview Elementary School, Euclid High School, and Ss Robert & William Catholic School.
Ownership History
Date
Name
Owned For
Owner Type
Purchase Details
Closed on
Aug 19, 2004
Sold by
Payne Rhoda L
Bought by
Hansen Robert C and Hansen Eileen T
Current Estimated Value
Home Financials for this Owner
Home Financials are based on the most recent Mortgage that was taken out on this home.
Original Mortgage
$65,000
Interest Rate
6.08%
Mortgage Type
Purchase Money Mortgage
Purchase Details
Closed on
Aug 23, 2001
Sold by
Tomaro Mary V
Bought by
Payne Rhoda L
Purchase Details
Closed on
Mar 23, 1984
Sold by
Jevac Josephine M
Bought by
Tomaro Victor P
Purchase Details
Closed on
Aug 5, 1975
Sold by
Jevec John and J M
Bought by
Jevac Josephine M
Purchase Details
Closed on
Jan 1, 1975
Bought by
Jevec John and J M
Create a Home Valuation Report for This Property
The Home Valuation Report is an in-depth analysis detailing your home's value as well as a comparison with similar homes in the area
Home Values in the Area
Average Home Value in this Area
Purchase History
| Date | Buyer | Sale Price | Title Company |
|---|---|---|---|
| Hansen Robert C | $140,000 | Real Living Title Agency L | |
| Payne Rhoda L | -- | -- | |
| Tomaro Victor P | $66,500 | -- | |
| Jevac Josephine M | -- | -- | |
| Jevec John | -- | -- |
Source: Public Records
Mortgage History
| Date | Status | Borrower | Loan Amount |
|---|---|---|---|
| Closed | Hansen Robert C | $65,000 |
Source: Public Records
Tax History
| Year | Tax Paid | Tax Assessment Tax Assessment Total Assessment is a certain percentage of the fair market value that is determined by local assessors to be the total taxable value of land and additions on the property. | Land | Improvement |
|---|---|---|---|---|
| 2024 | $3,569 | $61,705 | $12,005 | $49,700 |
| 2023 | $3,047 | $44,310 | $9,940 | $34,370 |
| 2022 | $3,011 | $44,310 | $9,940 | $34,370 |
| 2021 | $3,356 | $44,310 | $9,940 | $34,370 |
| 2020 | $3,341 | $41,020 | $9,210 | $31,820 |
| 2019 | $3,007 | $117,200 | $26,300 | $90,900 |
| 2018 | $2,913 | $41,020 | $9,210 | $31,820 |
| 2017 | $3,029 | $35,600 | $7,840 | $27,760 |
| 2016 | $3,035 | $35,600 | $7,840 | $27,760 |
| 2015 | $2,763 | $35,600 | $7,840 | $27,760 |
| 2014 | $2,763 | $35,600 | $7,840 | $27,760 |
Source: Public Records
Map
Nearby Homes
- 25801 Lake Shore Blvd Unit 29
- 25801 Lake Shore Blvd Unit 25
- 25801 Lake Shore Blvd Unit 112
- 25801 Lake Shore Blvd Unit 85
- 25801 Lakeshore Blvd Unit 42
- 325 E 264th St
- 27175 Cameron Ave
- 427 E 275th St
- 141 Eastbrook Dr
- 440 E 271st St
- 325 E 257th St
- 110 E 252nd St
- 28507 Lakeshore Blvd
- 355 E 257th St
- 28525 Lakeshore Blvd
- 625 Lloyd Rd
- 27430 Forestview Ave
- 28642 Forest Rd
- 27125 Mallard Ave
- 29310 Grand Blvd
Your Personal Tour Guide
Ask me questions while you tour the home.