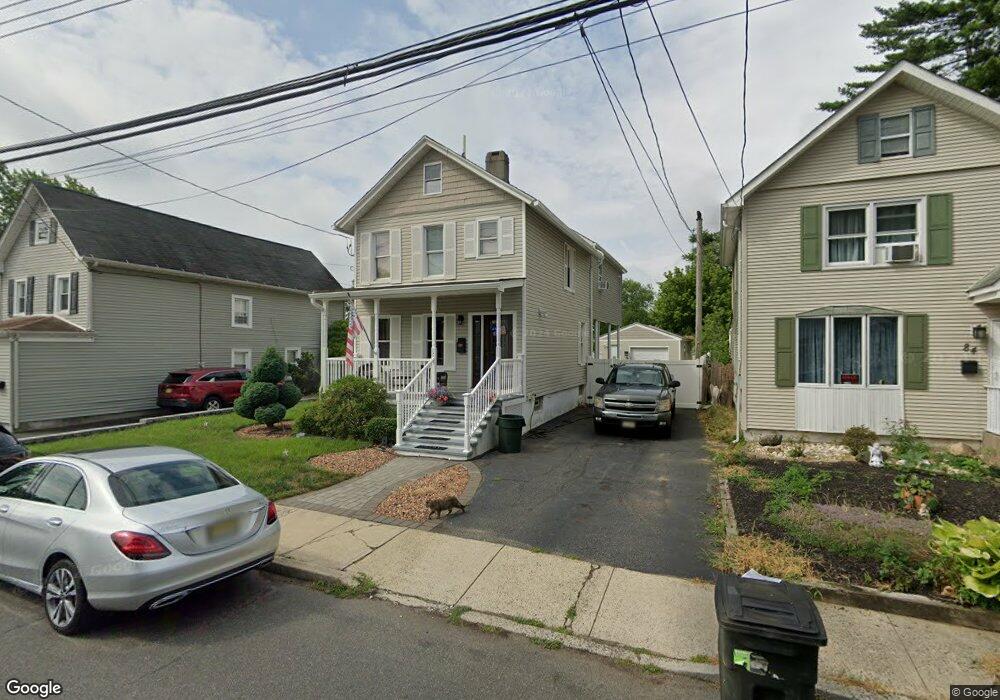
86 Fulton St Keyport, NJ 07735
Estimated Value: $668,021 - $703,000
3
Beds
3
Baths
2,130
Sq Ft
$319/Sq Ft
Est. Value
About This Home
This home is located at 86 Fulton St, Keyport, NJ 07735 and is currently estimated at $680,505, approximately $319 per square foot. 86 Fulton St is a home located in Monmouth County with nearby schools including Keyport Central School, Keyport High School, and Icob Academy.
Ownership History
Date
Name
Owned For
Owner Type
Purchase Details
Closed on
Apr 11, 2001
Sold by
Booth Edwin
Bought by
Margagliano Joseph
Current Estimated Value
Home Financials for this Owner
Home Financials are based on the most recent Mortgage that was taken out on this home.
Original Mortgage
$165,200
Interest Rate
6.92%
Purchase Details
Closed on
Dec 9, 1999
Sold by
Federal National Mortgage Association
Bought by
Booth Edwin and Booth Kathryn
Home Financials for this Owner
Home Financials are based on the most recent Mortgage that was taken out on this home.
Original Mortgage
$84,816
Interest Rate
7.83%
Mortgage Type
FHA
Create a Home Valuation Report for This Property
The Home Valuation Report is an in-depth analysis detailing your home's value as well as a comparison with similar homes in the area
Home Values in the Area
Average Home Value in this Area
Purchase History
| Date | Buyer | Sale Price | Title Company |
|---|---|---|---|
| Margagliano Joseph | $175,200 | -- | |
| Booth Edwin | $84,900 | -- |
Source: Public Records
Mortgage History
| Date | Status | Borrower | Loan Amount |
|---|---|---|---|
| Previous Owner | Margagliano Joseph | $165,200 | |
| Previous Owner | Booth Edwin | $84,816 |
Source: Public Records
Tax History Compared to Growth
Tax History
| Year | Tax Paid | Tax Assessment Tax Assessment Total Assessment is a certain percentage of the fair market value that is determined by local assessors to be the total taxable value of land and additions on the property. | Land | Improvement |
|---|---|---|---|---|
| 2025 | $11,099 | $581,400 | $208,500 | $372,900 |
| 2024 | $10,832 | $536,200 | $181,300 | $354,900 |
| 2023 | $10,832 | $492,800 | $157,700 | $335,100 |
| 2022 | $9,687 | $328,000 | $137,100 | $190,900 |
| 2021 | $9,687 | $383,800 | $123,600 | $260,200 |
| 2020 | $9,328 | $366,800 | $119,400 | $247,400 |
| 2019 | $8,328 | $328,000 | $106,300 | $221,700 |
| 2018 | $9,532 | $366,600 | $93,100 | $273,500 |
| 2017 | $9,552 | $366,400 | $96,300 | $270,100 |
| 2016 | $8,696 | $336,400 | $96,300 | $240,100 |
| 2015 | $8,523 | $328,200 | $91,300 | $236,900 |
| 2014 | $8,035 | $312,400 | $66,300 | $246,100 |
Source: Public Records
Map
Nearby Homes