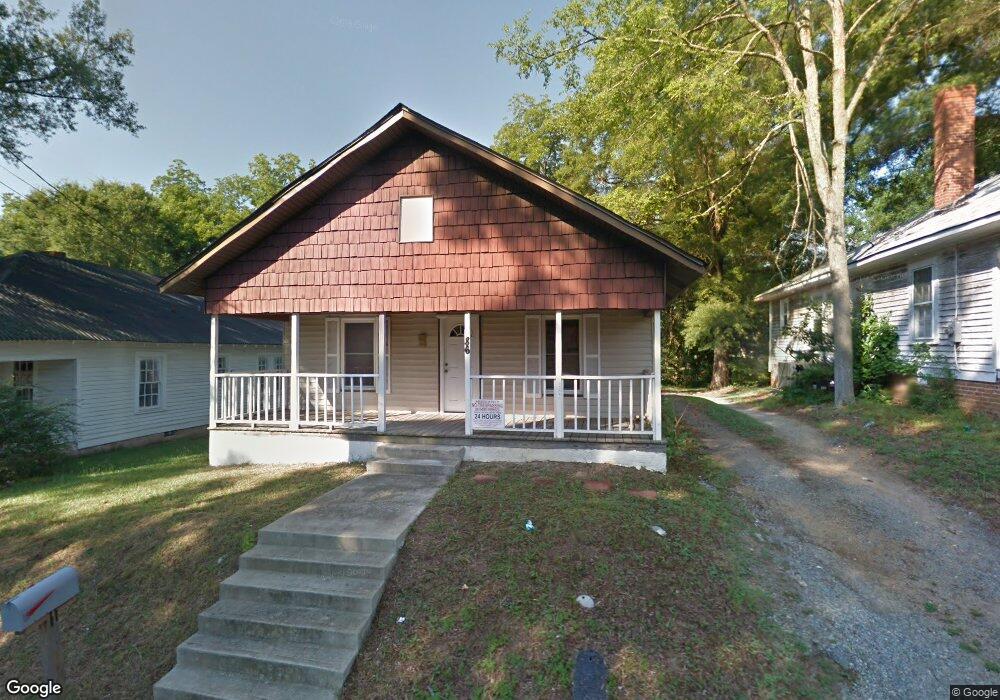
86 James St SW Concord, NC 28025
Estimated Value: $163,000 - $218,000
3
Beds
1
Bath
1,050
Sq Ft
$186/Sq Ft
Est. Value
About This Home
This home is located at 86 James St SW, Concord, NC 28025 and is currently estimated at $195,075, approximately $185 per square foot. 86 James St SW is a home located in Cabarrus County with nearby schools including W.M. Irvin Elementary School, Concord Middle School, and Concord Academy.
Ownership History
Date
Name
Owned For
Owner Type
Purchase Details
Closed on
Nov 10, 2020
Sold by
Rivera Teresa
Bought by
Duarte Blandi
Current Estimated Value
Purchase Details
Closed on
Aug 19, 2014
Sold by
Ajs Properties Llc
Bought by
Rivera Teresa
Purchase Details
Closed on
May 1, 2009
Sold by
Us Bank National Association
Bought by
Ajs Properties Llc
Purchase Details
Closed on
Feb 17, 2009
Sold by
Lightner Walter and Lightner Walter
Bought by
Us Bank National Association
Purchase Details
Closed on
Apr 28, 2006
Sold by
Lightner Enterprises Inc
Bought by
Lightner Walter
Home Financials for this Owner
Home Financials are based on the most recent Mortgage that was taken out on this home.
Original Mortgage
$68,000
Interest Rate
9.99%
Mortgage Type
Fannie Mae Freddie Mac
Purchase Details
Closed on
Aug 9, 2005
Sold by
The Bank Of New York
Bought by
Lightner Enterprises Inc
Purchase Details
Closed on
Apr 12, 2005
Sold by
Howard Richard and Howard Sherri C
Bought by
The Bank Of New York
Create a Home Valuation Report for This Property
The Home Valuation Report is an in-depth analysis detailing your home's value as well as a comparison with similar homes in the area
Home Values in the Area
Average Home Value in this Area
Purchase History
| Date | Buyer | Sale Price | Title Company |
|---|---|---|---|
| Duarte Blandi | $30,000 | None Available | |
| Rivera Teresa | $35,000 | None Available | |
| Ajs Properties Llc | $20,000 | None Available | |
| Us Bank National Association | $59,000 | None Available | |
| Lightner Walter | -- | None Available | |
| Lightner Enterprises Inc | $23,500 | -- | |
| The Bank Of New York | $53,440 | -- |
Source: Public Records
Mortgage History
| Date | Status | Borrower | Loan Amount |
|---|---|---|---|
| Previous Owner | Lightner Walter | $68,000 |
Source: Public Records
Tax History Compared to Growth
Tax History
| Year | Tax Paid | Tax Assessment Tax Assessment Total Assessment is a certain percentage of the fair market value that is determined by local assessors to be the total taxable value of land and additions on the property. | Land | Improvement |
|---|---|---|---|---|
| 2025 | $1,573 | $157,930 | $50,000 | $107,930 |
| 2024 | $1,573 | $157,930 | $50,000 | $107,930 |
| 2023 | $472 | $38,670 | $9,000 | $29,670 |
| 2022 | $472 | $38,670 | $9,000 | $29,670 |
| 2021 | $472 | $38,670 | $9,000 | $29,670 |
| 2020 | $906 | $74,270 | $9,000 | $65,270 |
| 2019 | $672 | $55,080 | $5,500 | $49,580 |
| 2018 | $661 | $55,080 | $5,500 | $49,580 |
| 2017 | $650 | $55,080 | $5,500 | $49,580 |
| 2016 | $386 | $54,820 | $6,500 | $48,320 |
| 2015 | $647 | $54,820 | $6,500 | $48,320 |
| 2014 | $647 | $54,820 | $6,500 | $48,320 |
Source: Public Records
Map
Nearby Homes
- 94 James St SW
- 136 Melba Ave SW
- 149 Crowell Dr SW
- 52 Fenix Dr SW
- 230 Corban Ave SW
- 149 Melrose Dr SW
- 98 Ring Ave SW
- 199 Mahan St SW
- 118 Cabarrus Ave W
- 1 Lincoln St SW
- 210 Lincoln St SW
- 241 Booker Dr SW
- 223 Tournament Dr SW
- 221 Tournament Dr SW
- 7 Scott St SW
- 144 Robbins St SW
- 60 Valley St NW
- 258 Carver Ave SW
- 257 Broad Dr SW
- 250 Franklin Ave NW
- 90 James St SW
- 82 James St SW
- 81 Crowell Dr SW
- 93 Crowell Dr SW
- 85 James St SW
- 89 James St SW
- 81 James St SW
- 93 James St SW
- 173 Young Ave SW
- 73 James St SW
- 177 Young Ave SW
- 177 Young Ave SW Unit A
- 177 Young Ave SW Unit 4
- 181 Young Ave SW
- 185 Young Ave SW
- 107 Crowell Dr SW Unit 109
- 167 Young Ave SW
- 71 James St SW
- 161 Corban Ave SW
- 189 Young Ave SW