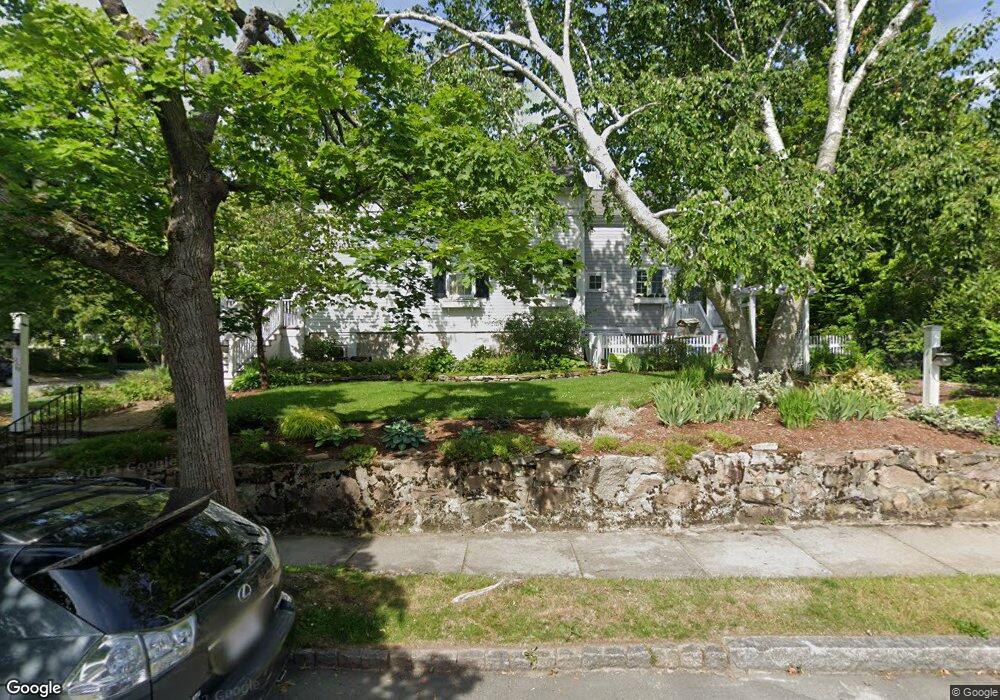
86 Laurel St Fairhaven, MA 02719
Estimated Value: $584,000 - $795,000
3
Beds
2
Baths
2,238
Sq Ft
$319/Sq Ft
Est. Value
About This Home
This home is located at 86 Laurel St, Fairhaven, MA 02719 and is currently estimated at $712,956, approximately $318 per square foot. 86 Laurel St is a home located in Bristol County with nearby schools including Fairhaven High School, City On A Hill Charter Public School New Bedford, and St. Joseph School.
Ownership History
Date
Name
Owned For
Owner Type
Purchase Details
Closed on
Jun 13, 2011
Sold by
Getchell Arlene F
Bought by
Arlene F Getchell T and Getchell Arlene F
Current Estimated Value
Purchase Details
Closed on
Sep 17, 2004
Sold by
Lebeau Betsy A and Lebeau Richard O
Bought by
Getchell Arlene F and Lebeau Betsy A
Purchase Details
Closed on
Oct 16, 1998
Sold by
Dixon Walter H
Bought by
Lebeau Richard O and Lebeau Betsy A
Home Financials for this Owner
Home Financials are based on the most recent Mortgage that was taken out on this home.
Original Mortgage
$100,000
Interest Rate
6.8%
Mortgage Type
Purchase Money Mortgage
Create a Home Valuation Report for This Property
The Home Valuation Report is an in-depth analysis detailing your home's value as well as a comparison with similar homes in the area
Home Values in the Area
Average Home Value in this Area
Purchase History
| Date | Buyer | Sale Price | Title Company |
|---|---|---|---|
| Arlene F Getchell T | -- | -- | |
| Getchell Arlene F | $512,000 | -- | |
| Lebeau Richard O | $170,000 | -- |
Source: Public Records
Mortgage History
| Date | Status | Borrower | Loan Amount |
|---|---|---|---|
| Previous Owner | Lebeau Richard O | $100,000 |
Source: Public Records
Tax History
| Year | Tax Paid | Tax Assessment Tax Assessment Total Assessment is a certain percentage of the fair market value that is determined by local assessors to be the total taxable value of land and additions on the property. | Land | Improvement |
|---|---|---|---|---|
| 2025 | $63 | $672,800 | $243,900 | $428,900 |
| 2024 | $6,224 | $674,300 | $243,900 | $430,400 |
| 2023 | $5,973 | $600,300 | $210,400 | $389,900 |
| 2022 | $5,944 | $581,600 | $191,700 | $389,900 |
| 2021 | $6,081 | $538,600 | $174,200 | $364,400 |
| 2020 | $8,119 | $488,100 | $174,200 | $313,900 |
| 2019 | $5,036 | $431,500 | $149,300 | $282,200 |
| 2018 | $6,206 | $411,500 | $142,100 | $269,400 |
| 2017 | $4,781 | $397,100 | $136,700 | $260,400 |
| 2016 | $4,804 | $394,400 | $134,000 | $260,400 |
| 2015 | $4,752 | $391,100 | $134,000 | $257,100 |
Source: Public Records
Map
Nearby Homes
Your Personal Tour Guide
Ask me questions while you tour the home.