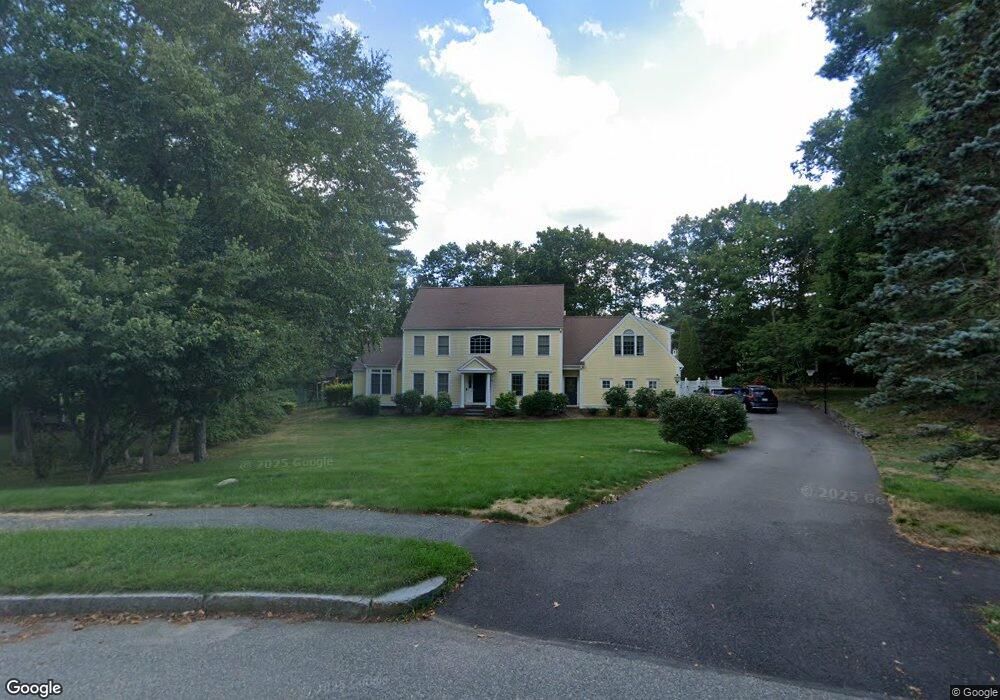
86 Linden Ln Hanover, MA 02339
Estimated Value: $1,212,064 - $1,469,000
4
Beds
3
Baths
3,224
Sq Ft
$419/Sq Ft
Est. Value
About This Home
This home is located at 86 Linden Ln, Hanover, MA 02339 and is currently estimated at $1,349,516, approximately $418 per square foot. 86 Linden Ln is a home located in Plymouth County with nearby schools including Hanover High School, South Shore Charter Public School, and Holy Family Elementary School.
Ownership History
Date
Name
Owned For
Owner Type
Purchase Details
Closed on
Sep 2, 2025
Sold by
Taylor Kenneth F and Taylor Patricia A
Bought by
Taylor Ft and Taylor
Current Estimated Value
Purchase Details
Closed on
Jul 20, 2004
Sold by
Coffey Edward M and Coffey Mary A
Bought by
Taylor Kenneth F and Tayklor Patricia A
Home Financials for this Owner
Home Financials are based on the most recent Mortgage that was taken out on this home.
Original Mortgage
$410,000
Interest Rate
6.25%
Mortgage Type
Purchase Money Mortgage
Purchase Details
Closed on
Dec 30, 1998
Sold by
Longwater Rt and Sealund Kevin P
Bought by
Coffey Edward M and Coffey Mary A
Create a Home Valuation Report for This Property
The Home Valuation Report is an in-depth analysis detailing your home's value as well as a comparison with similar homes in the area
Home Values in the Area
Average Home Value in this Area
Purchase History
| Date | Buyer | Sale Price | Title Company |
|---|---|---|---|
| Taylor Ft | -- | -- | |
| Taylor Ft | -- | -- | |
| Taylor Kenneth F | $785,000 | -- | |
| Taylor Kenneth F | $785,000 | -- | |
| Coffey Edward M | $150,000 | -- |
Source: Public Records
Mortgage History
| Date | Status | Borrower | Loan Amount |
|---|---|---|---|
| Previous Owner | Coffey Edward M | $397,000 | |
| Previous Owner | Coffey Edward M | $410,000 |
Source: Public Records
Tax History Compared to Growth
Tax History
| Year | Tax Paid | Tax Assessment Tax Assessment Total Assessment is a certain percentage of the fair market value that is determined by local assessors to be the total taxable value of land and additions on the property. | Land | Improvement |
|---|---|---|---|---|
| 2025 | $12,881 | $1,043,000 | $337,000 | $706,000 |
| 2024 | $12,518 | $974,900 | $337,000 | $637,900 |
| 2023 | $12,092 | $896,400 | $306,300 | $590,100 |
| 2022 | $12,339 | $809,100 | $269,600 | $539,500 |
| 2021 | $7,867 | $745,000 | $245,000 | $500,000 |
| 2020 | $12,156 | $745,300 | $267,300 | $478,000 |
| 2019 | $7,495 | $725,600 | $278,400 | $447,200 |
| 2018 | $7,489 | $702,000 | $298,500 | $403,500 |
| 2017 | $7,276 | $683,100 | $270,800 | $412,300 |
| 2016 | $10,949 | $649,400 | $246,300 | $403,100 |
| 2015 | $10,488 | $649,400 | $246,300 | $403,100 |
Source: Public Records
Map
Nearby Homes
- 118 Bates Way
- 216 Whiting St
- 70 Dillingham Way
- 1239 Main St
- 375 Webster St
- 8 Old Farm Rd
- 120 Deerfield Ln
- 141 Deerfield Ln
- 53 Chestnut St
- 436 E Water St
- 276 Woodland Dr
- 206-208 Hinghm St
- 718 Market St
- 354 Webster St
- 62 Larchmont Ln
- 116 Spring Meadow Ln
- 86 Damon Rd
- 38 Levin Rd
- 49 Liberty St
- 80 Coolidge Rd