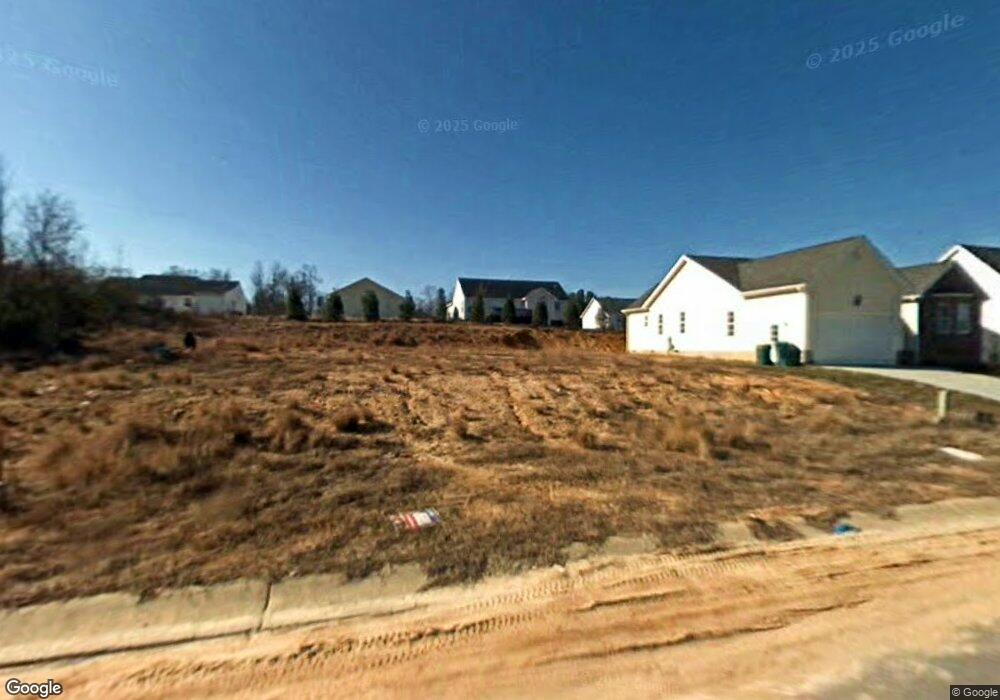
86 Locket Dr Unit 151 Clayton, NC 27520
Estimated Value: $308,000 - $320,000
3
Beds
3
Baths
1,596
Sq Ft
$198/Sq Ft
Est. Value
About This Home
This home is located at 86 Locket Dr Unit 151, Clayton, NC 27520 and is currently estimated at $315,672, approximately $197 per square foot. 86 Locket Dr Unit 151 is a home located in Johnston County with nearby schools including West Clayton Elementary School, Clayton Middle School, and Clayton High.
Ownership History
Date
Name
Owned For
Owner Type
Purchase Details
Closed on
Mar 25, 2013
Sold by
Stock Loan Services Llc
Bought by
Spruill Crystal J
Current Estimated Value
Home Financials for this Owner
Home Financials are based on the most recent Mortgage that was taken out on this home.
Original Mortgage
$125,000
Outstanding Balance
$90,988
Interest Rate
4.25%
Mortgage Type
Adjustable Rate Mortgage/ARM
Estimated Equity
$224,684
Purchase Details
Closed on
Oct 17, 2012
Sold by
Land Of Kanaan Llc
Bought by
Stock Loan Services Llc
Purchase Details
Closed on
Jun 24, 2009
Sold by
Crabill Daniel and Crabill Crystal E
Bought by
Land Of Kanaan Llc
Home Financials for this Owner
Home Financials are based on the most recent Mortgage that was taken out on this home.
Original Mortgage
$142,400
Interest Rate
4.88%
Mortgage Type
Construction
Create a Home Valuation Report for This Property
The Home Valuation Report is an in-depth analysis detailing your home's value as well as a comparison with similar homes in the area
Home Values in the Area
Average Home Value in this Area
Purchase History
| Date | Buyer | Sale Price | Title Company |
|---|---|---|---|
| Spruill Crystal J | $125,000 | None Available | |
| Stock Loan Services Llc | $141,000 | None Available | |
| Land Of Kanaan Llc | $25,000 | Fidelity Natl Title Ins Co |
Source: Public Records
Mortgage History
| Date | Status | Borrower | Loan Amount |
|---|---|---|---|
| Open | Spruill Crystal J | $125,000 | |
| Previous Owner | Land Of Kanaan Llc | $142,400 |
Source: Public Records
Tax History Compared to Growth
Tax History
| Year | Tax Paid | Tax Assessment Tax Assessment Total Assessment is a certain percentage of the fair market value that is determined by local assessors to be the total taxable value of land and additions on the property. | Land | Improvement |
|---|---|---|---|---|
| 2025 | $3,242 | $321,010 | $80,000 | $241,010 |
| 2024 | $2,496 | $189,120 | $45,500 | $143,620 |
| 2023 | $2,440 | $189,120 | $45,500 | $143,620 |
| 2022 | $2,515 | $189,120 | $45,500 | $143,620 |
| 2021 | $2,477 | $189,120 | $45,500 | $143,620 |
| 2020 | $2,534 | $189,120 | $45,500 | $143,620 |
| 2019 | $2,534 | $189,120 | $45,500 | $143,620 |
| 2018 | $2,035 | $149,640 | $27,000 | $122,640 |
| 2017 | $1,990 | $149,640 | $27,000 | $122,640 |
| 2016 | $1,990 | $149,640 | $27,000 | $122,640 |
| 2015 | $1,953 | $149,640 | $27,000 | $122,640 |
| 2014 | $1,953 | $149,640 | $27,000 | $122,640 |
Source: Public Records
Map
Nearby Homes
- 112 Kelly Ln
- 200 Hunter Way
- 37 W Cannalily Ln
- 1261 Grovewood Dr
- 2001 Mckinnon Dr
- 1268 Grovewood Dr
- 2008 Mckinnon Dr
- 1029 Cove Cir
- 2857 Bennington Dr
- 265 Stone Valley Ln
- 104 S Nikol Way
- 316 Waterford Dr
- 1212 Woodbriar St
- 128 Glengariff Ln
- 214 Thumper Way
- 507 Westminster Dr
- 212 Wexford Dr
- 200 Waterford Dr
- 418 Averasboro Dr
- 128 Plymouth Dr
- 86 Locket Dr
- 100 Locket Dr Unit 150
- 100 Locket Dr
- 72 Locket Dr
- 114 Locket Dr
- 114 Locket Dr Unit L149
- 0 Locket Dr Unit 1775046
- 0 Locket Dr Unit 1677468
- 0 Locket Dr Unit 150 TR1775046
- 0 Locket Dr Unit 150 1677468
- 0 Locket Dr Unit 150
- 524 Hunter Way
- 520 Hunter Way
- 528 Hunter Way
- 56 Locket Dr
- 516 Hunter Way
- 103 Locket Dr
- 77 Locket Dr
- 128 Locket Dr
- 532 Hunter Way