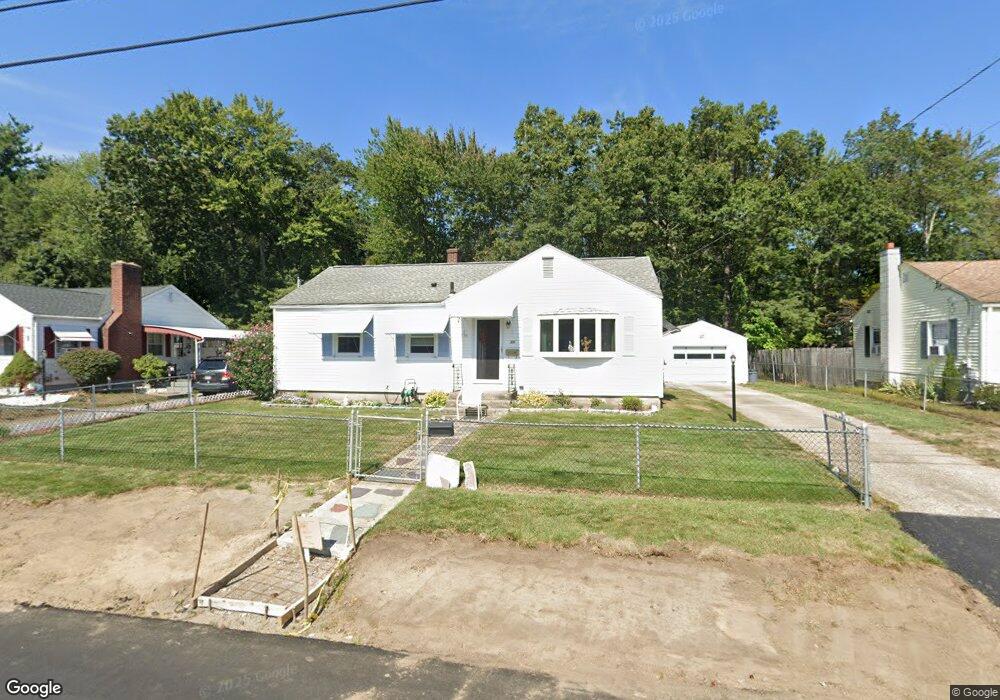
86 Lukasik St Chicopee, MA 01020
Fairview NeighborhoodEstimated Value: $284,000 - $315,000
2
Beds
1
Bath
960
Sq Ft
$307/Sq Ft
Est. Value
About This Home
This home is located at 86 Lukasik St, Chicopee, MA 01020 and is currently estimated at $295,047, approximately $307 per square foot. 86 Lukasik St is a home located in Hampden County with nearby schools including Streiber Elementary School, Fairview Middle School, and Chicopee Comprehensive High School.
Ownership History
Date
Name
Owned For
Owner Type
Purchase Details
Closed on
Aug 29, 1986
Bought by
Gallant Bruce A and Gallant Beverly A
Current Estimated Value
Create a Home Valuation Report for This Property
The Home Valuation Report is an in-depth analysis detailing your home's value as well as a comparison with similar homes in the area
Home Values in the Area
Average Home Value in this Area
Purchase History
| Date | Buyer | Sale Price | Title Company |
|---|---|---|---|
| Gallant Bruce A | -- | -- |
Source: Public Records
Mortgage History
| Date | Status | Borrower | Loan Amount |
|---|---|---|---|
| Open | Gallant Bruce A | $24,000 | |
| Open | Gallant Bruce A | $62,000 | |
| Closed | Gallant Bruce A | $80,000 | |
| Closed | Gallant Bruce A | $80,000 |
Source: Public Records
Tax History Compared to Growth
Tax History
| Year | Tax Paid | Tax Assessment Tax Assessment Total Assessment is a certain percentage of the fair market value that is determined by local assessors to be the total taxable value of land and additions on the property. | Land | Improvement |
|---|---|---|---|---|
| 2025 | $3,561 | $234,900 | $101,200 | $133,700 |
| 2024 | $3,383 | $229,200 | $99,200 | $130,000 |
| 2023 | $3,210 | $211,900 | $90,200 | $121,700 |
| 2022 | $3,090 | $181,900 | $78,400 | $103,500 |
| 2021 | $2,944 | $167,200 | $71,300 | $95,900 |
| 2020 | $2,851 | $163,300 | $73,200 | $90,100 |
| 2019 | $2,830 | $157,600 | $73,200 | $84,400 |
| 2018 | $2,743 | $149,800 | $69,700 | $80,100 |
| 2017 | $2,581 | $149,100 | $65,600 | $83,500 |
| 2016 | $2,591 | $153,200 | $65,600 | $87,600 |
| 2015 | $2,580 | $147,100 | $65,600 | $81,500 |
| 2014 | $1,290 | $147,100 | $65,600 | $81,500 |
Source: Public Records
Map
Nearby Homes
- 311 Montcalm St
- 15 Hudson Ave
- 68 7th Ave
- 55 Dowds Ln
- 81 Mccarthy Ave
- 24 Blanchard St
- 17 Yorktown Ct
- 98 Greenpoint Cir
- 519 Prospect St
- 18 Susan Ave
- 80 Ann St
- 90 Anson St
- 442 Prospect St
- 2085 Memorial Dr
- 35 Ludlow Rd
- 5 Marion St
- 118 Willimansett St
- 40 Greenwood Terrace
- 71 Greenwood Terrace
- 63-65 Mosher St