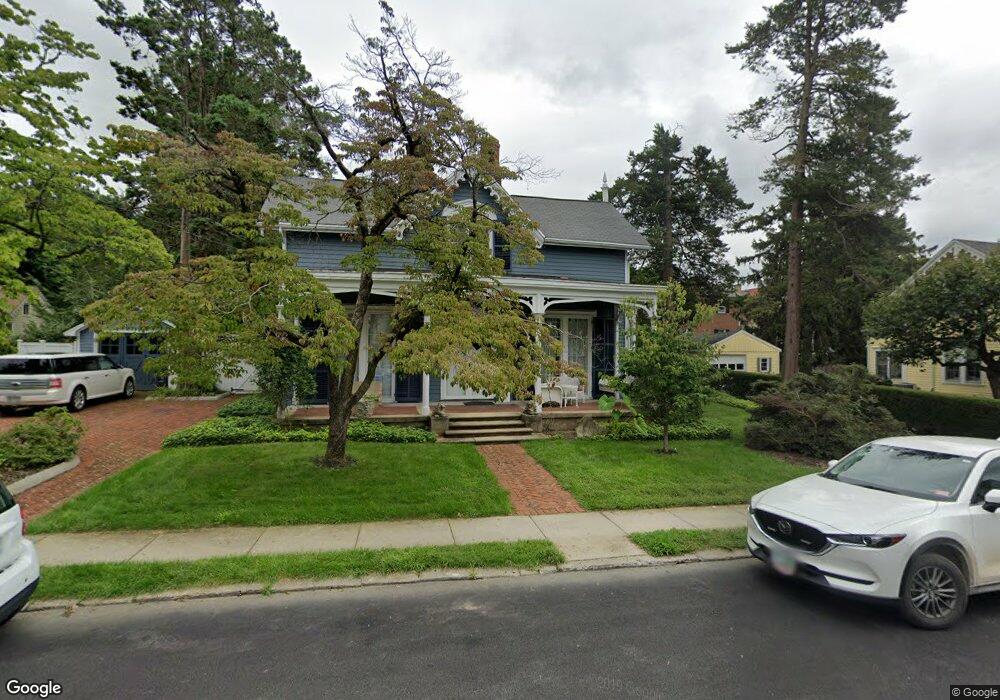
86 Maple Ave Hastings On Hudson, NY 10706
Estimated Value: $1,055,000 - $1,651,000
--
Bed
2
Baths
2,899
Sq Ft
$479/Sq Ft
Est. Value
About This Home
This home is located at 86 Maple Ave, Hastings On Hudson, NY 10706 and is currently estimated at $1,389,412, approximately $479 per square foot. 86 Maple Ave is a home located in Westchester County with nearby schools including Hastings High School, Hudson Lab School, and The Masters School.
Ownership History
Date
Name
Owned For
Owner Type
Purchase Details
Closed on
Jun 20, 2023
Sold by
Wilson Mary J
Bought by
Andrew D Wilson Revocable Living Trust and 2023 Mary J Wilson Revocable Living Trust
Current Estimated Value
Purchase Details
Closed on
Feb 2, 2015
Sold by
Wilson Andrew D and Wilson Mary J
Bought by
Wilson Mary J
Purchase Details
Closed on
Jul 28, 2005
Sold by
Patterson Catherine B
Bought by
Wilson Andrew J and Wilson Mary J
Home Financials for this Owner
Home Financials are based on the most recent Mortgage that was taken out on this home.
Original Mortgage
$885,000
Interest Rate
5.79%
Mortgage Type
Purchase Money Mortgage
Create a Home Valuation Report for This Property
The Home Valuation Report is an in-depth analysis detailing your home's value as well as a comparison with similar homes in the area
Home Values in the Area
Average Home Value in this Area
Purchase History
| Date | Buyer | Sale Price | Title Company |
|---|---|---|---|
| Andrew D Wilson Revocable Living Trust | -- | None Listed On Document | |
| Wilson Mary J | -- | The Judicial Title Ins Agenc | |
| Wilson Andrew J | $1,260,000 | -- |
Source: Public Records
Mortgage History
| Date | Status | Borrower | Loan Amount |
|---|---|---|---|
| Previous Owner | Wilson Andrew J | $885,000 |
Source: Public Records
Tax History Compared to Growth
Tax History
| Year | Tax Paid | Tax Assessment Tax Assessment Total Assessment is a certain percentage of the fair market value that is determined by local assessors to be the total taxable value of land and additions on the property. | Land | Improvement |
|---|---|---|---|---|
| 2024 | $38,548 | $1,400,600 | $492,200 | $908,400 |
| 2023 | $25,313 | $1,332,300 | $447,500 | $884,800 |
| 2022 | $38,221 | $1,295,600 | $447,500 | $848,100 |
| 2021 | $37,359 | $1,222,300 | $447,500 | $774,800 |
| 2020 | $37,064 | $1,167,400 | $497,200 | $670,200 |
| 2019 | $35,871 | $1,167,400 | $497,200 | $670,200 |
| 2018 | $41,720 | $1,135,500 | $497,200 | $638,300 |
| 2017 | $6,616 | $1,103,700 | $497,200 | $606,500 |
| 2016 | $849,808 | $1,061,200 | $497,200 | $564,000 |
| 2015 | $18,162 | $26,000 | $2,600 | $23,400 |
| 2014 | $18,162 | $25,400 | $2,600 | $22,800 |
| 2013 | $18,162 | $25,400 | $2,600 | $22,800 |
Source: Public Records
Map
Nearby Homes
- 31 Maple Ave Unit 2A
- 57 Maple Ave Unit 2B
- 565 Broadway Unit 1A
- 555 Broadway Unit 1H
- 737 N Broadway Unit 2D
- 132 Edgars Ln
- 445 Broadway Unit 2R
- 445 Broadway Unit 2-O
- 445 Broadway Unit 3A
- 31 Hillside Ave
- 24 School St
- 7 Ravine Dr
- 11 Fairlawn Ave
- 65 Circle Dr
- 2 Marble Terrace
- 72 Magnolia Dr
- 40 Floral Dr
- 1 Nodine St Unit 1
- 6 Nodine St Unit 6
- 5 Nodine St Unit 5