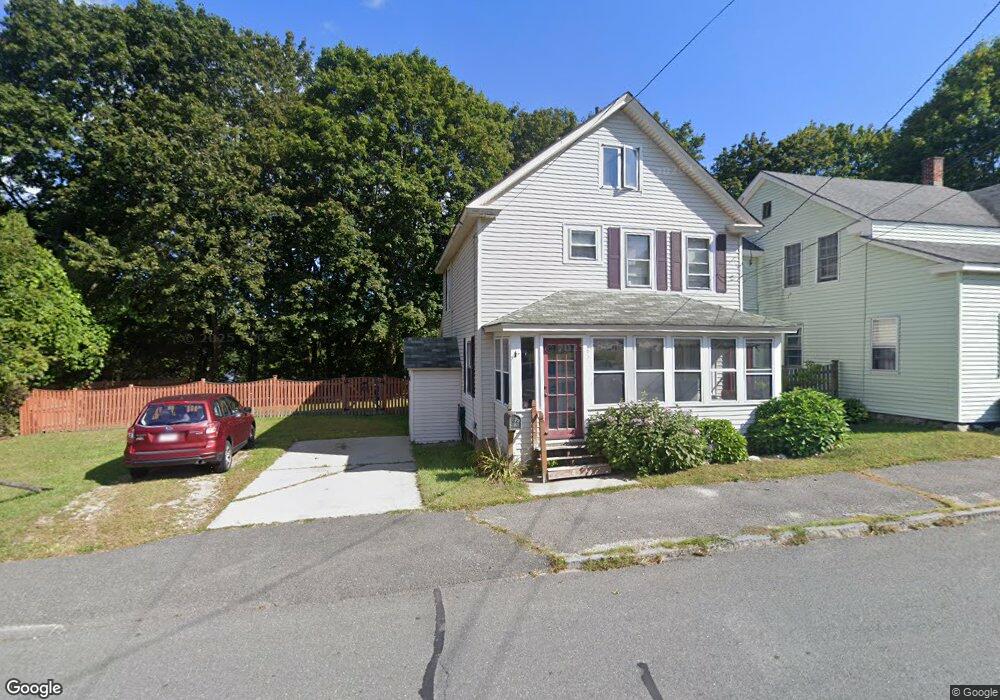
86 Pontoosuc Ave Pittsfield, MA 01201
Estimated Value: $202,000 - $282,000
3
Beds
1
Bath
1,252
Sq Ft
$186/Sq Ft
Est. Value
About This Home
This home is located at 86 Pontoosuc Ave, Pittsfield, MA 01201 and is currently estimated at $233,040, approximately $186 per square foot. 86 Pontoosuc Ave is a home located in Berkshire County with nearby schools including Silvio O. Conte Community School, John T. Reid Middle School, and Taconic High School.
Ownership History
Date
Name
Owned For
Owner Type
Purchase Details
Closed on
May 28, 2015
Sold by
Dicicco Michael C
Bought by
Dicicco Jordan N
Current Estimated Value
Home Financials for this Owner
Home Financials are based on the most recent Mortgage that was taken out on this home.
Original Mortgage
$132,500
Outstanding Balance
$102,257
Interest Rate
3.65%
Mortgage Type
New Conventional
Estimated Equity
$130,783
Purchase Details
Closed on
Dec 23, 2009
Sold by
Dicicco Michael and Dicicco Jordan N
Bought by
Dicicco Michael C and Dicicco Jordan N
Home Financials for this Owner
Home Financials are based on the most recent Mortgage that was taken out on this home.
Original Mortgage
$12,000
Interest Rate
4.92%
Mortgage Type
Purchase Money Mortgage
Purchase Details
Closed on
Dec 11, 2007
Sold by
Wilson Jeffrey D
Bought by
Dicicco Michael and Williams Jordan N
Create a Home Valuation Report for This Property
The Home Valuation Report is an in-depth analysis detailing your home's value as well as a comparison with similar homes in the area
Home Values in the Area
Average Home Value in this Area
Purchase History
| Date | Buyer | Sale Price | Title Company |
|---|---|---|---|
| Dicicco Jordan N | -- | -- | |
| Dicicco Jordan N | -- | -- | |
| Dicicco Jordan N | -- | -- | |
| Dicicco Michael C | -- | -- | |
| Dicicco Michael C | -- | -- | |
| Dicicco Michael C | -- | -- | |
| Dicicco Michael | $175,000 | -- | |
| Dicicco Michael | $175,000 | -- | |
| Dicicco Michael | $175,000 | -- |
Source: Public Records
Mortgage History
| Date | Status | Borrower | Loan Amount |
|---|---|---|---|
| Open | Dicicco Jordan N | $132,500 | |
| Closed | Dicicco Jordan N | $132,500 | |
| Previous Owner | Dicicco Michael C | $12,000 |
Source: Public Records
Tax History Compared to Growth
Tax History
| Year | Tax Paid | Tax Assessment Tax Assessment Total Assessment is a certain percentage of the fair market value that is determined by local assessors to be the total taxable value of land and additions on the property. | Land | Improvement |
|---|---|---|---|---|
| 2025 | $3,089 | $172,200 | $33,100 | $139,100 |
| 2024 | $2,692 | $145,900 | $33,100 | $112,800 |
| 2023 | $2,488 | $135,800 | $33,100 | $102,700 |
| 2022 | $2,225 | $119,900 | $30,600 | $89,300 |
| 2021 | $2,220 | $115,300 | $30,600 | $84,700 |
| 2020 | $2,107 | $106,900 | $25,100 | $81,800 |
| 2019 | $2,057 | $105,900 | $27,100 | $78,800 |
| 2018 | $2,063 | $103,100 | $27,100 | $76,000 |
| 2017 | $1,996 | $101,700 | $28,600 | $73,100 |
| 2016 | $2,050 | $109,300 | $38,600 | $70,700 |
| 2015 | -- | $109,300 | $38,600 | $70,700 |
Source: Public Records
Map
Nearby Homes