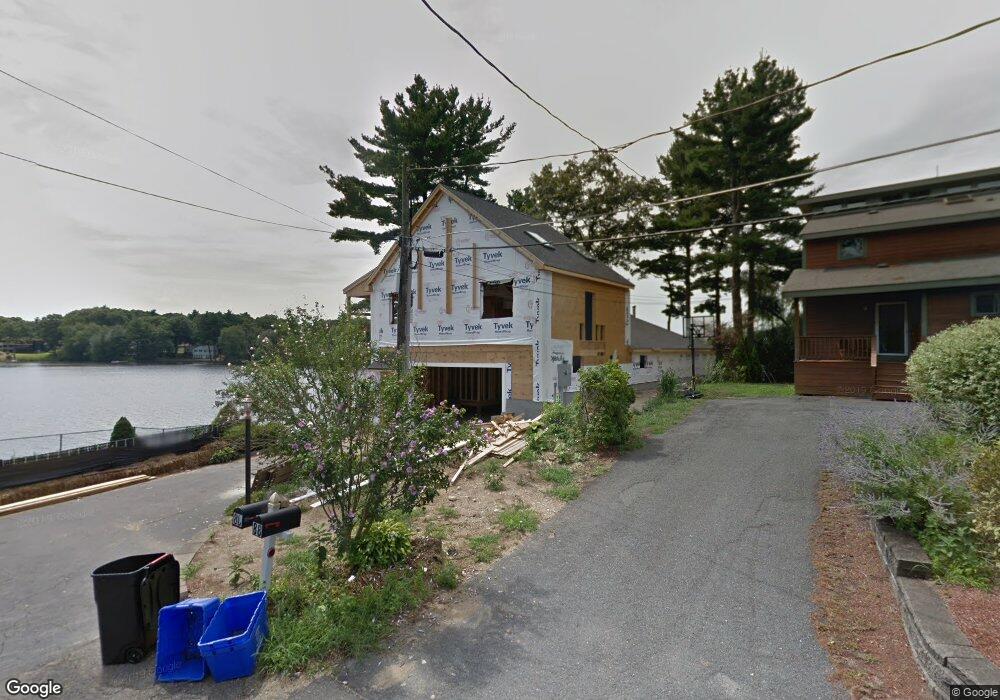
86 Ridge Rd Foxboro, MA 02035
Estimated Value: $900,248 - $1,067,000
4
Beds
5
Baths
2,508
Sq Ft
$402/Sq Ft
Est. Value
About This Home
This home is located at 86 Ridge Rd, Foxboro, MA 02035 and is currently estimated at $1,007,312, approximately $401 per square foot. 86 Ridge Rd is a home located in Norfolk County with nearby schools including Foxborough High School, Foxborough Regional Charter School, and The Sage School.
Ownership History
Date
Name
Owned For
Owner Type
Purchase Details
Closed on
Jun 13, 2002
Sold by
Anna W Elibero T
Bought by
Fisher Yan and Fisher Margarita
Current Estimated Value
Purchase Details
Closed on
Apr 19, 1996
Sold by
Yazbak Eugene M
Bought by
Anna W Eliberg T
Purchase Details
Closed on
Jun 1, 1992
Sold by
Weinacker Ernest P
Bought by
Yazbak Eugene P
Purchase Details
Closed on
Oct 27, 1987
Sold by
Weinacker Barbara
Bought by
Weinacker Ernest P
Create a Home Valuation Report for This Property
The Home Valuation Report is an in-depth analysis detailing your home's value as well as a comparison with similar homes in the area
Home Values in the Area
Average Home Value in this Area
Purchase History
| Date | Buyer | Sale Price | Title Company |
|---|---|---|---|
| Fisher Yan | $464,000 | -- | |
| Anna W Eliberg T | $170,000 | -- | |
| Yazbak Eugene P | $144,000 | -- | |
| Weinacker Ernest P | $140,000 | -- |
Source: Public Records
Mortgage History
| Date | Status | Borrower | Loan Amount |
|---|---|---|---|
| Open | Weinacker Ernest P | $60,000 | |
| Open | Weinacker Ernest P | $410,000 |
Source: Public Records
Tax History Compared to Growth
Tax History
| Year | Tax Paid | Tax Assessment Tax Assessment Total Assessment is a certain percentage of the fair market value that is determined by local assessors to be the total taxable value of land and additions on the property. | Land | Improvement |
|---|---|---|---|---|
| 2025 | $10,568 | $799,400 | $273,800 | $525,600 |
| 2024 | $10,366 | $767,300 | $278,800 | $488,500 |
| 2023 | $10,049 | $707,200 | $265,400 | $441,800 |
| 2022 | $10,043 | $691,700 | $251,600 | $440,100 |
| 2021 | $9,764 | $662,400 | $233,000 | $429,400 |
| 2020 | $9,651 | $662,400 | $233,000 | $429,400 |
| 2019 | $9,223 | $627,400 | $221,900 | $405,500 |
| 2018 | $8,574 | $588,500 | $221,900 | $366,600 |
| 2017 | $8,061 | $536,000 | $207,200 | $328,800 |
| 2016 | $7,588 | $512,000 | $176,900 | $335,100 |
| 2015 | $7,546 | $496,800 | $142,800 | $354,000 |
| 2014 | $7,308 | $487,500 | $133,500 | $354,000 |
Source: Public Records
Map
Nearby Homes