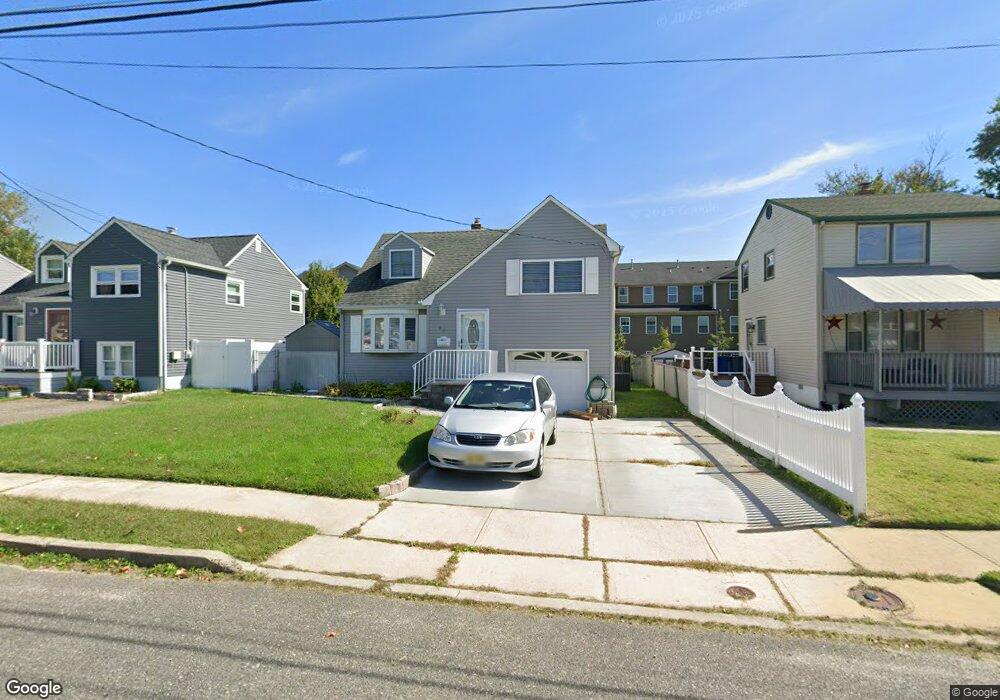
86 Ridge Terrace Neptune, NJ 07753
Estimated Value: $432,000 - $562,000
3
Beds
1
Bath
1,276
Sq Ft
$380/Sq Ft
Est. Value
About This Home
This home is located at 86 Ridge Terrace, Neptune, NJ 07753 and is currently estimated at $485,111, approximately $380 per square foot. 86 Ridge Terrace is a home located in Monmouth County with nearby schools including Woodrow Wilson Elementary School and St Rose High School.
Ownership History
Date
Name
Owned For
Owner Type
Purchase Details
Closed on
Aug 7, 2023
Sold by
Bennett Ean
Bought by
Figucroa Jonathan J and Kelly Sung Mi
Current Estimated Value
Home Financials for this Owner
Home Financials are based on the most recent Mortgage that was taken out on this home.
Original Mortgage
$15,000
Interest Rate
6.71%
Purchase Details
Closed on
Jul 9, 2018
Sold by
Bennett Ean and Bennett Tracey E
Bought by
Bennett Ean
Home Financials for this Owner
Home Financials are based on the most recent Mortgage that was taken out on this home.
Original Mortgage
$158,730
Interest Rate
5.5%
Mortgage Type
FHA
Purchase Details
Closed on
Feb 9, 2018
Sold by
Wayne Bennett Estate
Bought by
Bennett Ean and Bennett Tracey E
Purchase Details
Closed on
Aug 7, 1979
Sold by
United States Of America By Va
Bought by
Bennett Wayne and Bennett Maureen
Create a Home Valuation Report for This Property
The Home Valuation Report is an in-depth analysis detailing your home's value as well as a comparison with similar homes in the area
Home Values in the Area
Average Home Value in this Area
Purchase History
| Date | Buyer | Sale Price | Title Company |
|---|---|---|---|
| Figucroa Jonathan J | $360,000 | Title Protection Group Llc | |
| Bennett Ean | $120,000 | Green Label Title | |
| Bennett Ean | -- | -- | |
| Bennett Wayne | -- | -- |
Source: Public Records
Mortgage History
| Date | Status | Borrower | Loan Amount |
|---|---|---|---|
| Closed | Figucroa Jonathan J | $15,000 | |
| Open | Figucroa Jonathan J | $349,200 | |
| Previous Owner | Bennett Ean | $158,730 |
Source: Public Records
Tax History Compared to Growth
Tax History
| Year | Tax Paid | Tax Assessment Tax Assessment Total Assessment is a certain percentage of the fair market value that is determined by local assessors to be the total taxable value of land and additions on the property. | Land | Improvement |
|---|---|---|---|---|
| 2025 | $7,619 | $437,200 | $291,500 | $145,700 |
| 2024 | $7,619 | $404,400 | $265,100 | $139,300 |
| 2023 | $6,868 | $356,200 | $192,700 | $163,500 |
| 2022 | $5,776 | $295,400 | $145,300 | $150,100 |
| 2021 | $5,776 | $264,000 | $124,300 | $139,700 |
| 2020 | $5,766 | $251,700 | $119,500 | $132,200 |
| 2019 | $5,607 | $236,900 | $109,900 | $127,000 |
| 2018 | $5,478 | $221,700 | $102,200 | $119,500 |
| 2017 | $5,365 | $216,000 | $100,200 | $115,800 |
| 2016 | $5,279 | $212,000 | $105,000 | $107,000 |
| 2015 | $5,205 | $205,400 | $99,800 | $105,600 |
| 2014 | $5,295 | $183,400 | $90,300 | $93,100 |
Source: Public Records
Map
Nearby Homes
- 82 Ridge Terrace
- 49 Merritt Ave
- 3 5th Ave Unit Residence 401
- 3 5th Ave Unit Residence 208
- 3 5th Ave Unit Residence 104
- 3 5th Ave Unit Residence 207
- 3 5th Ave Unit Residence 307
- 3 5th Ave Unit Residence 109
- 3 5th Ave Unit Residence 303
- 3 5th Ave Unit Residence 102
- 3 5th Ave Unit Residence 106
- 3 5th Ave Unit Residence 305
- 3 5th Ave Unit Residence 409
- 3 5th Ave Unit Residence 107
- 3 5th Ave Unit Residence 308
- 3 5th Ave Unit Residence 103
- 3 5th Ave Unit Residence 302
- 3 5th Ave Unit Residence 405
- 3 5th Ave Unit Residence 205
- 3 5th Ave Unit Residence 201
- 84 Ridge Terrace
- 90 Ridge Terrace
- 37 Ridge Place
- 92 Ridge Terrace
- 80 Ridge Terrace
- 85 Ridge Terrace
- 83 Ridge Terrace
- 39 Ridge Place
- 94 Ridge Terrace
- 99 Steiner Ave
- 99 Steiner Ave Unit 34
- 99 Steiner Ave Unit 26
- 99 Steiner Ave Unit 23
- 99 Steiner Ave Unit 30
- 99 Steiner Ave Unit 17
- 99 Steiner Ave Unit 19
- 99 Steiner Ave Unit 1
- 99 Steiner Ave Unit 22
- 99 Steiner Ave Unit 20
- 99 Steiner Ave Unit 10