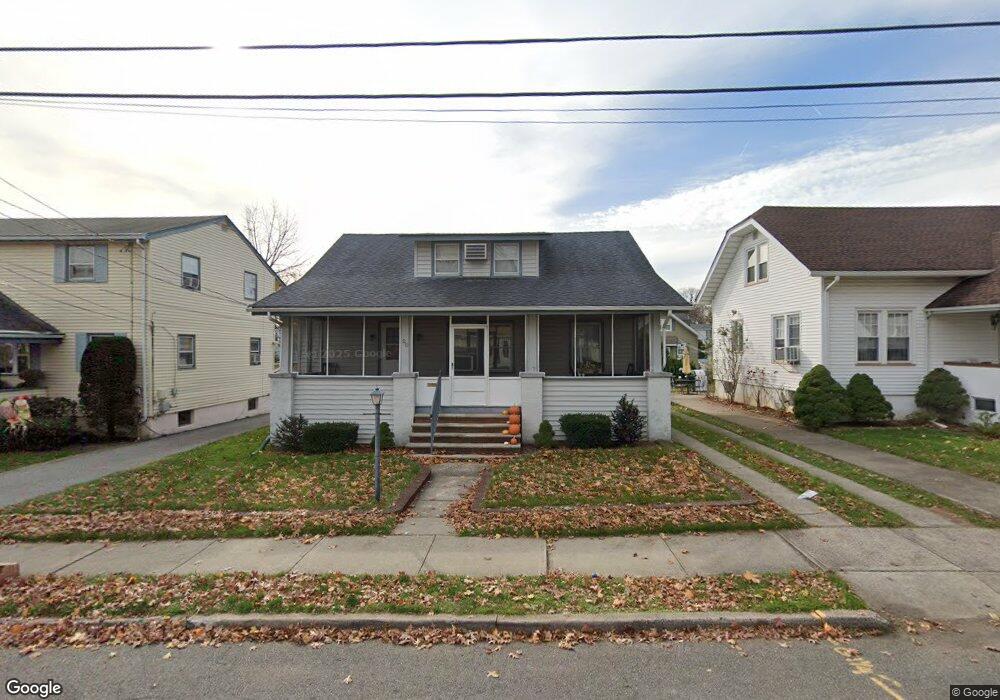
86 Sylvester Ave Hawthorne, NJ 07506
Estimated Value: $500,774 - $535,000
--
Bed
--
Bath
1,316
Sq Ft
$394/Sq Ft
Est. Value
About This Home
This home is located at 86 Sylvester Ave, Hawthorne, NJ 07506 and is currently estimated at $517,944, approximately $393 per square foot. 86 Sylvester Ave is a home located in Passaic County with nearby schools including Hawthorne High School, St Anthony School, and Hawthorne Christian Academy.
Ownership History
Date
Name
Owned For
Owner Type
Purchase Details
Closed on
Mar 30, 2020
Sold by
Wazaney Beth
Bought by
Laing Nicolas A and Buaya Kyle
Current Estimated Value
Home Financials for this Owner
Home Financials are based on the most recent Mortgage that was taken out on this home.
Original Mortgage
$289,656
Outstanding Balance
$256,600
Interest Rate
3.4%
Mortgage Type
FHA
Estimated Equity
$261,344
Purchase Details
Closed on
May 21, 2018
Sold by
Wazaney Beth and Graham Glenn
Bought by
Graham Wazaney Family Trust
Purchase Details
Closed on
Feb 22, 2018
Sold by
Wazaney Beth
Bought by
Wazaney Beth and Graham Genn
Purchase Details
Closed on
Feb 12, 2014
Sold by
Wazaney Beth Trustee
Bought by
Wazaney Beth
Purchase Details
Closed on
Feb 26, 2008
Sold by
Graham Calvin G and Graham Cornelia B
Bought by
Graham Family Trust
Create a Home Valuation Report for This Property
The Home Valuation Report is an in-depth analysis detailing your home's value as well as a comparison with similar homes in the area
Home Values in the Area
Average Home Value in this Area
Purchase History
| Date | Buyer | Sale Price | Title Company |
|---|---|---|---|
| Laing Nicolas A | $295,000 | None Available | |
| Graham Wazaney Family Trust | -- | None Available | |
| Wazaney Beth | -- | None Available | |
| Wazaney Beth | -- | -- | |
| Graham Family Trust | -- | -- |
Source: Public Records
Mortgage History
| Date | Status | Borrower | Loan Amount |
|---|---|---|---|
| Open | Laing Nicolas A | $289,656 |
Source: Public Records
Tax History Compared to Growth
Tax History
| Year | Tax Paid | Tax Assessment Tax Assessment Total Assessment is a certain percentage of the fair market value that is determined by local assessors to be the total taxable value of land and additions on the property. | Land | Improvement |
|---|---|---|---|---|
| 2025 | $9,299 | $305,700 | $161,500 | $144,200 |
| 2024 | $9,171 | $305,700 | $161,500 | $144,200 |
| 2022 | $9,018 | $305,700 | $161,500 | $144,200 |
| 2021 | $8,841 | $305,700 | $161,500 | $144,200 |
| 2020 | $8,716 | $305,700 | $161,500 | $144,200 |
| 2019 | $9,031 | $151,100 | $85,000 | $66,100 |
| 2018 | $8,835 | $151,100 | $85,000 | $66,100 |
| 2017 | $8,690 | $151,100 | $85,000 | $66,100 |
| 2016 | $8,569 | $151,100 | $85,000 | $66,100 |
| 2015 | $8,468 | $151,100 | $85,000 | $66,100 |
| 2014 | $8,120 | $151,100 | $85,000 | $66,100 |
Source: Public Records
Map
Nearby Homes
- 116 Post Ave
- 14 Heights Ave Unit 1X
- 126 Hawthorne Ave
- 19 Mawhinney Ave
- 84 Washington Ave
- 280 Central Ave
- 51 Pomona Ave
- 59 Lincoln Ave
- 61 Pomona Ave Unit 1X
- 406 Dixie Ave
- 251 Boulevard
- 61 10th Ave
- 151 South Ave
- 118 Diamond Bridge Ave
- 40 Heathcote Rd
- 2 Grand Ave Unit 8
- 111 Thornbury Ave
- 143 Parmelee Ave
- 82 Sylvester Ave
- 90 Sylvester Ave
- 94 Sylvester Ave
- 6 Taylor Ave
- 13 Taylor Ave
- 10 Taylor Ave
- 17 Taylor Ave
- 9 Taylor Ave
- 199 Hawthorne Ave
- 195 Hawthorne Ave Unit 1st Floor
- 193 Hawthorne Ave
- 193 Hawthorne Ave Unit 2nd Floor
- 91 Sylvester Ave
- 85 Sylvester Ave
- 89 Sylvester Ave
- 21 Taylor Ave
- 98 Sylvester Ave
- 81 Sylvester Ave
- 197 Hawthorne Ave
- 189 Hawthorne Ave