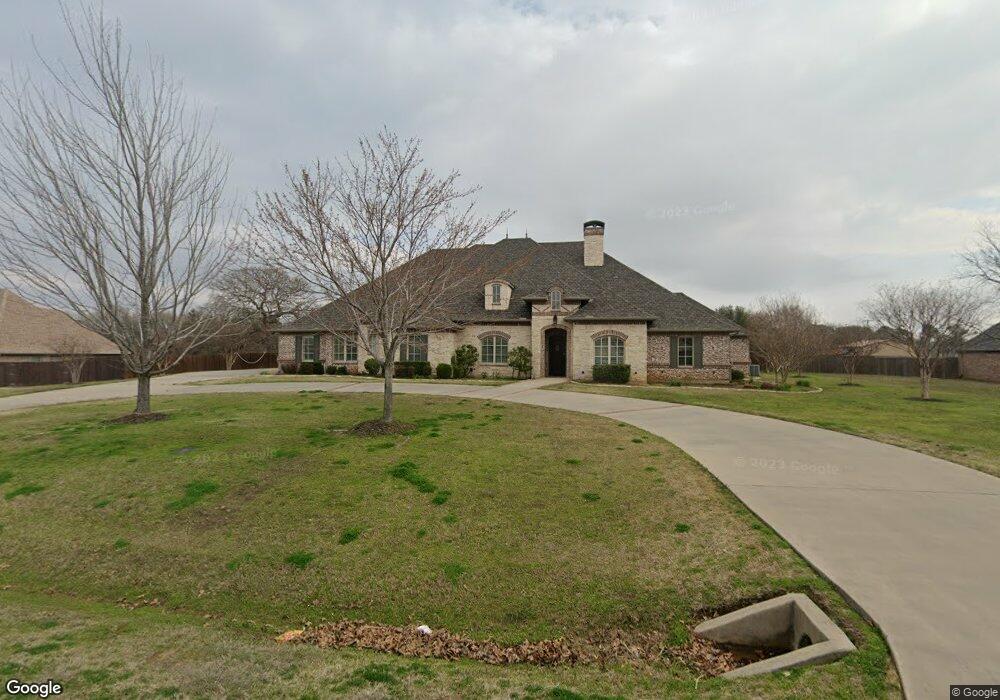
86 Tananger Springs Dr Denison, TX 75021
Estimated Value: $621,000 - $809,646
3
Beds
4
Baths
3,590
Sq Ft
$199/Sq Ft
Est. Value
About This Home
This home is located at 86 Tananger Springs Dr, Denison, TX 75021 and is currently estimated at $715,323, approximately $199 per square foot. 86 Tananger Springs Dr is a home located in Grayson County with nearby schools including Percy W. Neblett Elementary School, Dillingham Intermediate School, and Piner Middle School.
Ownership History
Date
Name
Owned For
Owner Type
Purchase Details
Closed on
Sep 16, 2009
Sold by
Elledge Harry L and Boothe Kyle
Bought by
Gladen Roy and Gladen Donna
Current Estimated Value
Purchase Details
Closed on
Feb 1, 2006
Sold by
Tananger Springs Llc and Dye Ben
Bought by
Elledge Harry L and Boothe Kyle
Create a Home Valuation Report for This Property
The Home Valuation Report is an in-depth analysis detailing your home's value as well as a comparison with similar homes in the area
Home Values in the Area
Average Home Value in this Area
Purchase History
| Date | Buyer | Sale Price | Title Company |
|---|---|---|---|
| Gladen Roy | -- | Red River Title Co | |
| Elledge Harry L | -- | None Available |
Source: Public Records
Tax History Compared to Growth
Tax History
| Year | Tax Paid | Tax Assessment Tax Assessment Total Assessment is a certain percentage of the fair market value that is determined by local assessors to be the total taxable value of land and additions on the property. | Land | Improvement |
|---|---|---|---|---|
| 2025 | $3,740 | $723,063 | $99,000 | $624,063 |
| 2024 | $11,560 | $684,401 | $0 | $0 |
| 2023 | $3,750 | $622,183 | $0 | $0 |
| 2022 | $10,621 | $565,621 | $0 | $0 |
| 2021 | $10,398 | $544,071 | $39,000 | $505,071 |
| 2020 | $10,006 | $467,455 | $39,000 | $428,455 |
| 2019 | $9,874 | $434,283 | $30,000 | $404,283 |
| 2018 | $8,571 | $410,633 | $30,000 | $380,633 |
| 2017 | $8,018 | $381,590 | $30,000 | $351,590 |
| 2016 | $7,749 | $368,782 | $30,000 | $338,782 |
| 2015 | $0 | $346,000 | $25,000 | $321,000 |
| 2014 | -- | $350,943 | $25,000 | $325,943 |
Source: Public Records
Map
Nearby Homes
- 30 Tananger Springs Dr
- 376 Tananger Springs Dr
- 2025 Woodlake Rd
- 4813 Pinnacle Place
- 4604 Bello Vista Cir
- 2014 & 1910 Shannon Rd
- 4829 Adobe Ln
- TBD Adobe Ln
- 4517 Playa Ct
- 4605 Dripping Spring Rd
- TBD 1 Dripping Spring Rd
- 2330 Knight Rd
- 918 Cleve Cole
- 5585 S Fannin Ave
- 000 F M 691
- 920 Jefferson Way
- Evans Plan at Sweetwater Springs
- Peterson Plan at Sweetwater Springs
- 913 Jefferson Way
- Harrison Plan at Sweetwater Springs
- 104 Tananger Springs Dr
- 00 Tananger Springs Dr
- 1757 Woodlake Rd
- 87 Tananger Springs Dr
- 1841 Woodlake Rd
- 67 Tananger Springs Dr
- 138 Tananger Springs Dr
- 31 Tananger Springs Dr
- 1956 Woodlake Rd
- 1671 Woodlake Rd
- 139 Tananger Springs Dr
- 340 Tananger Springs Dr
- 1980 Woodlake Rd
- 4047 Woodlawn Rd
- 2004 Woodlake Rd
- 341 Tananger Springs Dr
- 187 Tananger Springs Dr
- 2018 Woodlake Rd
- 210 Tananger Springs Dr
- 377 Tananger Springs Dr