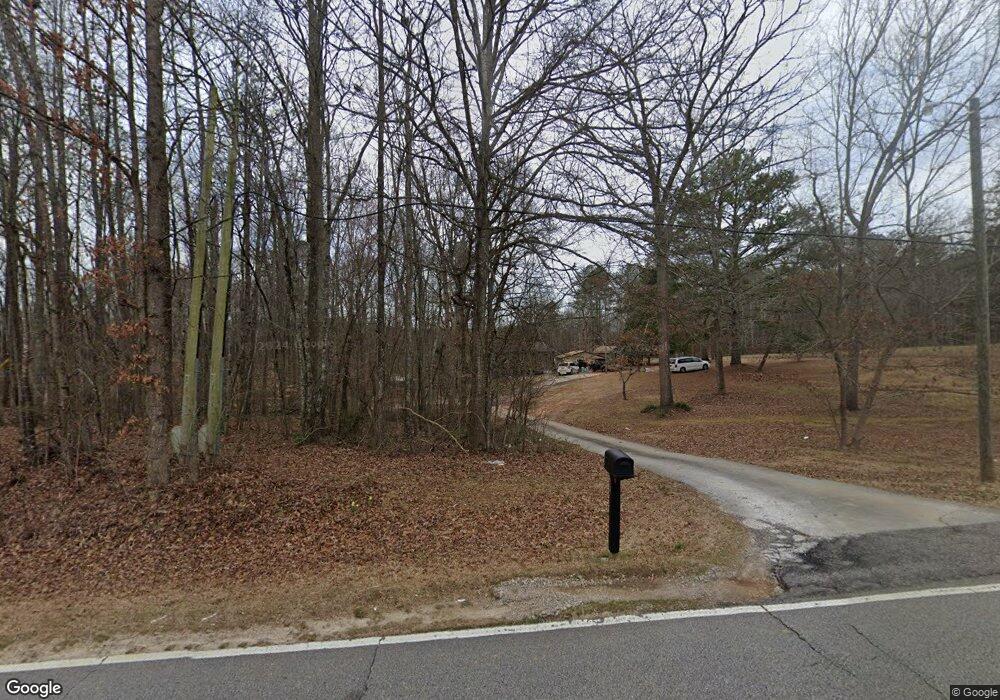
86 Taylors Gin Rd Temple, GA 30179
Estimated Value: $304,000 - $348,852
3
Beds
2
Baths
1,796
Sq Ft
$185/Sq Ft
Est. Value
About This Home
This home is located at 86 Taylors Gin Rd, Temple, GA 30179 and is currently estimated at $332,617, approximately $185 per square foot. 86 Taylors Gin Rd is a home located in Carroll County with nearby schools including Providence Elementary School, Temple Middle School, and Temple High School.
Ownership History
Date
Name
Owned For
Owner Type
Purchase Details
Closed on
Sep 28, 2022
Sold by
Radcliff Marvin B
Bought by
Gerstman Russell D and Gerstman Angela M
Current Estimated Value
Purchase Details
Closed on
Oct 27, 2016
Sold by
Marvin B
Bought by
Radcliff Marvin B and Radcliff Teresa
Home Financials for this Owner
Home Financials are based on the most recent Mortgage that was taken out on this home.
Original Mortgage
$50,000
Interest Rate
3.42%
Mortgage Type
New Conventional
Purchase Details
Closed on
Aug 18, 2015
Sold by
Hubbard Darrell
Bought by
Radcliff Barry
Purchase Details
Closed on
May 10, 2006
Sold by
Hubbard Darrell
Bought by
Hubbard Darrell and Hubbard Homer D
Home Financials for this Owner
Home Financials are based on the most recent Mortgage that was taken out on this home.
Original Mortgage
$7,500
Interest Rate
6.41%
Mortgage Type
New Conventional
Purchase Details
Closed on
Mar 1, 1978
Bought by
Darrell Hubbard
Create a Home Valuation Report for This Property
The Home Valuation Report is an in-depth analysis detailing your home's value as well as a comparison with similar homes in the area
Home Values in the Area
Average Home Value in this Area
Purchase History
| Date | Buyer | Sale Price | Title Company |
|---|---|---|---|
| Gerstman Russell D | $8,500 | -- | |
| Radcliff Marvin B | -- | -- | |
| Radcliff Barry | $110,000 | -- | |
| Hubbard Darrell | -- | -- | |
| Darrell Hubbard | $1,500 | -- |
Source: Public Records
Mortgage History
| Date | Status | Borrower | Loan Amount |
|---|---|---|---|
| Previous Owner | Radcliff Marvin B | $50,000 | |
| Previous Owner | Hubbard Darrell | $7,500 |
Source: Public Records
Tax History
| Year | Tax Paid | Tax Assessment Tax Assessment Total Assessment is a certain percentage of the fair market value that is determined by local assessors to be the total taxable value of land and additions on the property. | Land | Improvement |
|---|---|---|---|---|
| 2025 | $2,364 | $128,333 | $51,329 | $77,004 |
| 2024 | $2,391 | $128,333 | $51,329 | $77,004 |
| 2023 | $2,391 | $111,528 | $41,063 | $70,465 |
| 2022 | $1,807 | $82,074 | $25,060 | $57,014 |
| 2021 | $1,615 | $69,102 | $20,048 | $49,054 |
| 2020 | $1,491 | $62,086 | $18,225 | $43,861 |
| 2019 | $1,512 | $58,432 | $18,225 | $40,207 |
| 2018 | $1,216 | $46,312 | $11,110 | $35,202 |
| 2017 | $1,220 | $46,312 | $11,110 | $35,202 |
| 2016 | $1,159 | $46,312 | $11,110 | $35,202 |
| 2015 | $855 | $30,564 | $4,948 | $25,616 |
| 2014 | $746 | $30,564 | $4,948 | $25,616 |
Source: Public Records
Map
Nearby Homes
- 85 Taylors Gin Rd
- 126 Old Villa Rica Rd
- 804 Trestle Creek Ct
- 803 Trestle Creek Ct
- 300 Overland Trail
- 227 Waters Edge Pkwy
- 145 Gentle Breeze Ct
- 406 Splash Pointe
- 10 Leslie Ln
- 238 James Allen Place
- 480 Taylors Gin Rd
- 234 Temple Terrace
- 840 Windy Mill Ct
- 702 Miller Ct
- 723 Singleton Rd
- 725 Singleton Rd
- 116 Deer Crossing Unit LOT 4
- 727 Singleton Rd
- 502 Lanier Way
- 587 E Johnson St
- 97 Taylors Gin Rd
- 77 Taylors Gin Rd
- 65 Taylors Gin Rd
- 112 Taylors Gin Rd
- 175 Taylors Gin Rd
- 53 Taylors Gin Rd
- 125 Taylors Gin Rd
- 30 Taylors Gin Rd
- 90 Old Villa Rica Rd
- 53 Old Villa Rica Rd Unit RICA
- 97 Old Villa Rica Rd
- 164 Taylors Gin Rd
- 114 Old Villa Rica Rd
- 227 Taylors Gin Rd
- 103 Old Villa Rica Rd
- 231 Taylors Gin Rd
- 117 Old Villa Rica Rd
- 5O Ploof Rd
- 475 Willow Ln
- 334 Waters Edge Pkwy
Your Personal Tour Guide
Ask me questions while you tour the home.