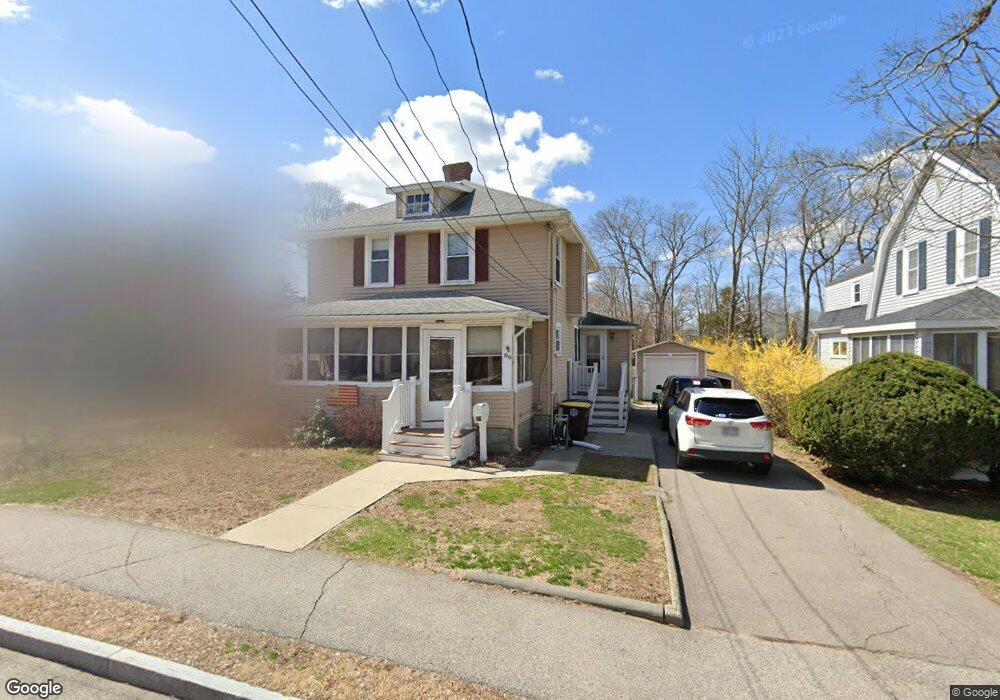
86 Webb St Weymouth, MA 02188
Weymouth Landing NeighborhoodEstimated Value: $550,734 - $599,000
3
Beds
2
Baths
1,424
Sq Ft
$408/Sq Ft
Est. Value
About This Home
This home is located at 86 Webb St, Weymouth, MA 02188 and is currently estimated at $581,434, approximately $408 per square foot. 86 Webb St is a home located in Norfolk County with nearby schools including Frederick C Murphy, Abigail Adams Middle School, and Weymouth Middle School Chapman.
Ownership History
Date
Name
Owned For
Owner Type
Purchase Details
Closed on
May 29, 1998
Sold by
Coneys John S and Coneys Joan M
Bought by
Newman Peter J and Newman Anne M
Current Estimated Value
Create a Home Valuation Report for This Property
The Home Valuation Report is an in-depth analysis detailing your home's value as well as a comparison with similar homes in the area
Home Values in the Area
Average Home Value in this Area
Purchase History
| Date | Buyer | Sale Price | Title Company |
|---|---|---|---|
| Newman Peter J | $163,000 | -- |
Source: Public Records
Mortgage History
| Date | Status | Borrower | Loan Amount |
|---|---|---|---|
| Open | Newman Peter J | $10,000 | |
| Open | Newman Peter J | $142,500 |
Source: Public Records
Tax History
| Year | Tax Paid | Tax Assessment Tax Assessment Total Assessment is a certain percentage of the fair market value that is determined by local assessors to be the total taxable value of land and additions on the property. | Land | Improvement |
|---|---|---|---|---|
| 2025 | $4,966 | $491,700 | $220,000 | $271,700 |
| 2024 | $4,814 | $468,700 | $209,600 | $259,100 |
| 2023 | $4,644 | $444,400 | $194,100 | $250,300 |
| 2022 | $4,542 | $396,300 | $179,700 | $216,600 |
| 2021 | $4,188 | $356,700 | $179,700 | $177,000 |
| 2020 | $3,997 | $335,300 | $179,700 | $155,600 |
| 2019 | $3,904 | $322,100 | $172,800 | $149,300 |
| 2018 | $3,790 | $303,200 | $164,500 | $138,700 |
| 2017 | $3,651 | $285,000 | $156,700 | $128,300 |
| 2016 | $3,511 | $274,300 | $150,700 | $123,600 |
| 2015 | $3,314 | $256,900 | $143,900 | $113,000 |
| 2014 | $3,180 | $239,100 | $133,900 | $105,200 |
Source: Public Records
Map
Nearby Homes
- 46 Roosevelt Rd
- 25 Richmond St
- 11 Richmond St
- 122 Washington St Unit Twenty-two
- 19 Vine St Unit 3
- 19 Vine St Unit 2
- 211 Roosevelt Rd
- 16 Beechwood Rd
- 15 Summer St
- 37 Lantern Ln
- 54 Edgemont Rd
- 41 Lantern Ln
- 33 Congress St
- 70 Biscayne Ave
- 49 Cornish St
- 312 Shaw St
- 300 Commercial St Unit 23
- 29-31 Broad Street Place
- 47 Academy Ave
- 70 Colonial Rd
Your Personal Tour Guide
Ask me questions while you tour the home.