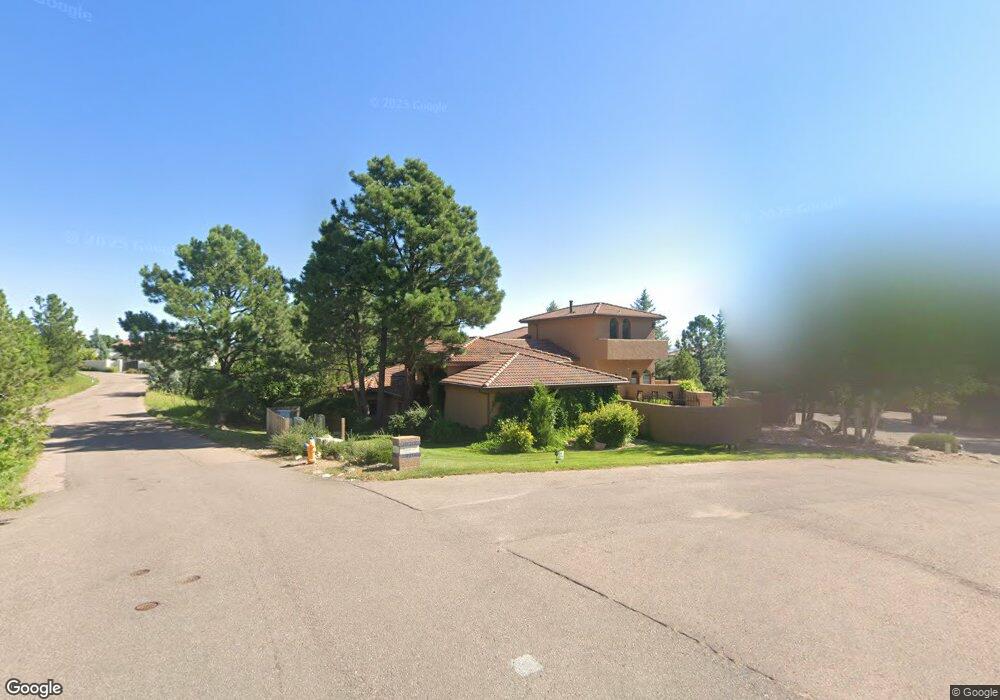
860 Appian Ct Colorado Springs, CO 80906
Broadmoor Resort Community NeighborhoodEstimated Value: $849,000 - $941,779
3
Beds
4
Baths
3,619
Sq Ft
$249/Sq Ft
Est. Value
About This Home
This home is located at 860 Appian Ct, Colorado Springs, CO 80906 and is currently estimated at $899,945, approximately $248 per square foot. 860 Appian Ct is a home located in El Paso County with nearby schools including Broadmoor Elementary School, Cheyenne Mountain Junior High School, and Cheyenne Mountain High School.
Ownership History
Date
Name
Owned For
Owner Type
Purchase Details
Closed on
Aug 19, 2019
Sold by
Williams Herbert L
Bought by
Moore Tamra J
Current Estimated Value
Purchase Details
Closed on
Aug 6, 2017
Sold by
Gb Equity Partnership Lllp
Bought by
Williams Herbert L
Purchase Details
Closed on
Sep 8, 2015
Sold by
Blume Eugenia M
Bought by
Gb Equity Partnership Lllp
Purchase Details
Closed on
Apr 25, 2011
Sold by
Blume Basil E
Bought by
Blume Eugenia M
Purchase Details
Closed on
Jul 26, 2004
Sold by
Royal Maile Inc
Bought by
Blume Basil E and Blume Eugenia M
Purchase Details
Closed on
Mar 28, 1994
Sold by
Sellon David R
Bought by
Marland Courts Assn
Purchase Details
Closed on
Mar 21, 1994
Sold by
Broadmoor Hotel Inc
Bought by
Marland Courts Association
Purchase Details
Closed on
Apr 5, 1991
Bought by
Williams Herbert L
Create a Home Valuation Report for This Property
The Home Valuation Report is an in-depth analysis detailing your home's value as well as a comparison with similar homes in the area
Home Values in the Area
Average Home Value in this Area
Purchase History
| Date | Buyer | Sale Price | Title Company |
|---|---|---|---|
| Moore Tamra J | $690,000 | Fidelity National Title | |
| Williams Herbert L | $400,000 | Land Title Guarantee Co | |
| Gb Equity Partnership Lllp | -- | None Available | |
| Blume Eugenia M | -- | None Available | |
| Blume Basil E | $200,000 | Unified Title Company | |
| Marland Courts Assn | -- | -- | |
| Marland Courts Association | -- | -- | |
| Williams Herbert L | $250,000 | -- | |
| Williams Herbert L | -- | -- | |
| Williams Herbert L | $800,000 | -- |
Source: Public Records
Tax History Compared to Growth
Tax History
| Year | Tax Paid | Tax Assessment Tax Assessment Total Assessment is a certain percentage of the fair market value that is determined by local assessors to be the total taxable value of land and additions on the property. | Land | Improvement |
|---|---|---|---|---|
| 2025 | $3,358 | $40,890 | -- | -- |
| 2024 | $3,258 | $49,390 | $9,720 | $39,670 |
| 2023 | $3,258 | $49,390 | $9,720 | $39,670 |
| 2022 | $3,468 | $47,750 | $6,600 | $41,150 |
| 2021 | $3,657 | $49,120 | $6,790 | $42,330 |
| 2020 | $2,422 | $31,750 | $5,290 | $26,460 |
| 2019 | $2,395 | $31,750 | $5,290 | $26,460 |
| 2018 | $2,271 | $29,580 | $4,680 | $24,900 |
| 2017 | $2,263 | $29,580 | $4,680 | $24,900 |
| 2016 | $2,224 | $29,810 | $4,780 | $25,030 |
| 2015 | $2,219 | $29,810 | $4,780 | $25,030 |
| 2014 | $2,067 | $27,740 | $4,780 | $22,960 |
Source: Public Records
Map
Nearby Homes
- 104 Marland Rd S
- 455 Roxbury Cir
- 260 Haversham Dr
- 4688 Stone Manor Heights
- 235 Haversham Dr
- 3520 Sebastian Heights
- 4365 Kincaid Ct
- 3865 Hermitage Dr
- 4335 Kincaid Ct
- 4490 Star Ranch Rd
- 920 Grey Mountain Point
- 34 Marland Rd
- 215 Hidden Creek Dr
- 4875 Willow Stone Heights
- 210 Hidden Creek Dr
- 4935 Newstead Place
- 352 Blue Windsor Ln
- 165 Clubridge Place
- 526 Penrose Blvd
- 583 Silver Oak Grove
- 840 Appian Ct
- 830 Appian Ct
- 950 Colonnade Ct
- 820 Appian Ct
- 4170 S Club Dr
- 4160 S Club Dr
- 960 Colonnade Ct
- 4150 S Club Dr
- 4015 S Club Dr
- 970 Colonnade Ct
- 960 Genesis Place
- 970 Genesis Place
- 775 Overlook Ridge Point
- 3955 S Club Dr
- 950 Genesis Place
- 763 Overlook Ridge Point
- 776 Overlook Ridge Point
- 113 Marland Rd S
- 105 Marland Rd S
- 787 Overlook Ridge Point