860 Deerview Ln Unit 11 Holland, MI 49423
South Holland NeighborhoodEstimated Value: $306,000 - $356,000
4
Beds
3
Baths
2,078
Sq Ft
$155/Sq Ft
Est. Value
About This Home
This home is located at 860 Deerview Ln Unit 11, Holland, MI 49423 and is currently estimated at $322,742, approximately $155 per square foot. 860 Deerview Ln Unit 11 is a home located in Allegan County with nearby schools including Hamilton High School, Pine Ridge Christian School, and Calvary Schools of Holland - Plasman Campus.
Ownership History
Date
Name
Owned For
Owner Type
Purchase Details
Closed on
Jun 30, 2005
Sold by
The Trustees Of The Richard W Gabbert Tr
Bought by
Schneider Kevin J
Current Estimated Value
Home Financials for this Owner
Home Financials are based on the most recent Mortgage that was taken out on this home.
Original Mortgage
$133,200
Interest Rate
5.74%
Mortgage Type
Fannie Mae Freddie Mac
Purchase Details
Closed on
Aug 16, 2000
Sold by
Gabbert Richard W and Gabbert Teri G
Bought by
Gabbert Richard W Trust
Purchase Details
Closed on
Aug 26, 1999
Sold by
Wolbert David and Wolbert Kristi
Bought by
Gabbert Richard W and Gabbert Teri G
Purchase Details
Closed on
Mar 15, 1996
Sold by
Deyoung Albert C and Deyoung Gloria D
Bought by
Wolbert David L and Wolbert Kristi J
Create a Home Valuation Report for This Property
The Home Valuation Report is an in-depth analysis detailing your home's value as well as a comparison with similar homes in the area
Home Values in the Area
Average Home Value in this Area
Purchase History
| Date | Buyer | Sale Price | Title Company |
|---|---|---|---|
| Schneider Kevin J | $166,500 | Chicago Title | |
| Gabbert Richard W Trust | -- | -- | |
| Gabbert Richard W | $162,000 | -- | |
| Wolbert David L | $151,800 | -- |
Source: Public Records
Mortgage History
| Date | Status | Borrower | Loan Amount |
|---|---|---|---|
| Closed | Schneider Kevin J | $133,200 |
Source: Public Records
Tax History Compared to Growth
Tax History
| Year | Tax Paid | Tax Assessment Tax Assessment Total Assessment is a certain percentage of the fair market value that is determined by local assessors to be the total taxable value of land and additions on the property. | Land | Improvement |
|---|---|---|---|---|
| 2025 | $2,422 | $143,300 | $42,500 | $100,800 |
| 2024 | $2,035 | $124,600 | $30,000 | $94,600 |
| 2023 | $2,035 | $125,200 | $30,000 | $95,200 |
| 2022 | $2,035 | $108,300 | $12,500 | $95,800 |
| 2021 | $2,041 | $110,700 | $12,500 | $98,200 |
| 2020 | $2,041 | $107,200 | $12,500 | $94,700 |
| 2019 | $0 | $99,800 | $12,500 | $87,300 |
| 2018 | $0 | $96,900 | $0 | $96,900 |
| 2017 | $0 | $90,800 | $0 | $90,800 |
| 2016 | $0 | $68,000 | $0 | $68,000 |
| 2015 | -- | $68,000 | $0 | $68,000 |
| 2014 | -- | $65,300 | $0 | $65,300 |
| 2013 | -- | $65,100 | $0 | $65,100 |
Source: Public Records
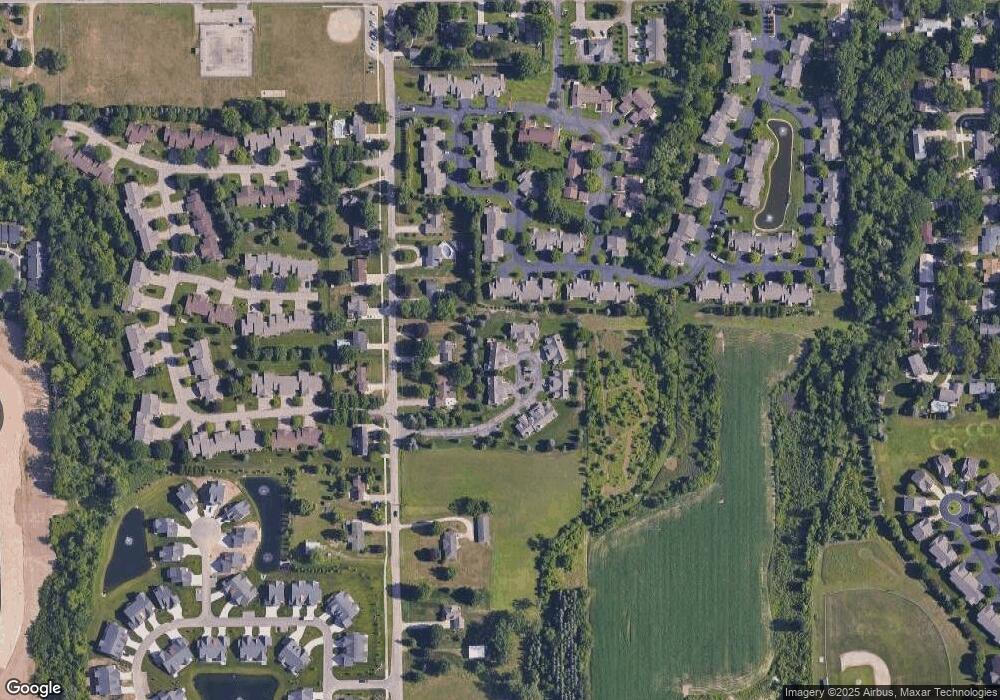
Map
Nearby Homes
- 886 Creekridge Dr
- 766 Clarewood Ct
- 743 Crestview St
- 6147 Lake Wind Ave Unit lot 62
- 776 Meadowbrook Ave
- 6096 147th Ave
- 663 Lugers Rd
- V/L 60th St
- 655 Lugers Rd
- 646 Spring Ln
- 879 W 26th St
- 804 Brook Village Dr
- 828 Brook Village Dr
- 814 Bertsch Dr
- 1092 S Shore Dr
- 6329 147th Ave
- 1092 Cobblestone Rd Unit 18
- 1130 S Shore Dr
- 833 Allen Dr
- 465 W 32nd St
- 862 Deerview Ln
- 855 Deerview Ln
- 855 Deerview Ln Unit 12
- 868 Deerview Ln Unit 9
- 857 Deerview Ln Unit 13
- 870 Deerview Ln
- 859 Deerview Ln Unit 1
- 4757 61st St
- 861 Deerview Ln
- 867 Clarewood Ct Unit 73
- 865 Clarewood Ct Unit 74
- 861 Clarewood Ct
- 861 Clarewood Ct Unit 11
- 867 Deerview Ln Unit 3
- 859 Clarewood Ct Unit 76
- 4751 61st St
- 869 Deerview Ln Unit 4
- 875 Deerview Ln Unit 5
- 877 Deerview Ln
- 855 Clarewood Ct