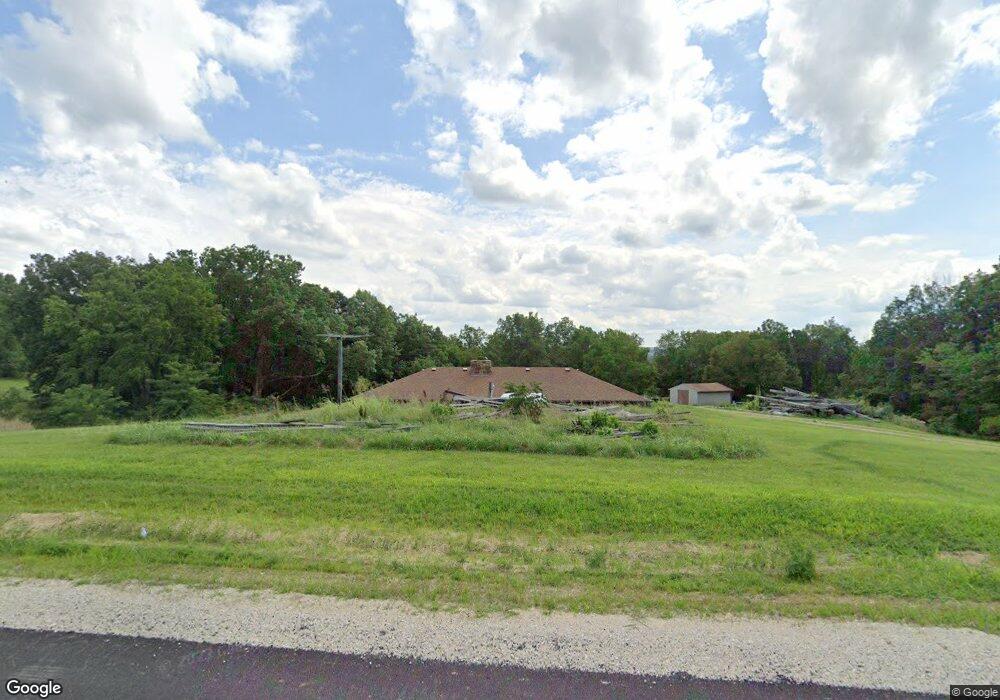
860 E Sample Rd Bloomington, IN 47408
Estimated Value: $259,000 - $336,000
2
Beds
2
Baths
1,232
Sq Ft
$252/Sq Ft
Est. Value
About This Home
This home is located at 860 E Sample Rd, Bloomington, IN 47408 and is currently estimated at $310,573, approximately $252 per square foot. 860 E Sample Rd is a home located in Monroe County with nearby schools including Marlin Elementary School, Tri-North Middle School, and Bloomington High School North.
Ownership History
Date
Name
Owned For
Owner Type
Purchase Details
Closed on
Nov 11, 2018
Sold by
Deventer Jacob Wayde Van
Bought by
The Board Of Commissioners Of The County
Current Estimated Value
Purchase Details
Closed on
Dec 23, 2015
Sold by
Fiscus Cindy L and Sexton Pamela J
Bought by
Vandeventer Jacob Wayde
Home Financials for this Owner
Home Financials are based on the most recent Mortgage that was taken out on this home.
Original Mortgage
$144,500
Interest Rate
3.96%
Mortgage Type
New Conventional
Purchase Details
Closed on
Sep 17, 2015
Sold by
Deventer Edith L Van
Bought by
Deventer Edith L Van and Sexton Pamela J
Create a Home Valuation Report for This Property
The Home Valuation Report is an in-depth analysis detailing your home's value as well as a comparison with similar homes in the area
Purchase History
| Date | Buyer | Sale Price | Title Company |
|---|---|---|---|
| The Board Of Commissioners Of The County | $13,000 | None Available | |
| Vandeventer Jacob Wayde | -- | None Available | |
| Deventer Edith L Van | -- | None Available |
Source: Public Records
Mortgage History
| Date | Status | Borrower | Loan Amount |
|---|---|---|---|
| Previous Owner | Vandeventer Jacob Wayde | $144,500 |
Source: Public Records
Tax History
| Year | Tax Paid | Tax Assessment Tax Assessment Total Assessment is a certain percentage of the fair market value that is determined by local assessors to be the total taxable value of land and additions on the property. | Land | Improvement |
|---|---|---|---|---|
| 2025 | $1,574 | $212,600 | $75,400 | $137,200 |
| 2024 | $1,574 | $205,100 | $62,900 | $142,200 |
| 2023 | $1,583 | $203,500 | $62,900 | $140,600 |
| 2022 | $1,410 | $189,400 | $62,900 | $126,500 |
| 2021 | $1,357 | $174,000 | $57,900 | $116,100 |
| 2020 | $1,244 | $161,000 | $52,900 | $108,100 |
| 2019 | $1,236 | $161,900 | $50,400 | $111,500 |
| 2018 | $1,236 | $157,900 | $50,400 | $107,500 |
| 2017 | $774 | $152,300 | $50,400 | $101,900 |
| 2016 | $591 | $136,300 | $36,900 | $99,400 |
| 2014 | $434 | $129,000 | $34,200 | $94,800 |
Source: Public Records
Map
Nearby Homes
- 7821 N Fox Hollow Rd
- 1363 W Lawson Rd
- 7867 N Fox Hollow Rd
- 8121 N Fox Hollow Rd
- 4355 E Streacher Rd
- TBD N State Road 37
- 1888 E Mel Currie Rd
- 1605 E Woodland Dr
- 1400 E Whisnand Rd
- 491 E Chambers Pike
- 4010 E Old Meyers Rd
- 8780 N Old State Road 37
- 3530 W Maple Grove Rd
- 609 E Audubon Dr
- 645 W Sylvan Ln
- 3455 E Bethel Ln
- 409 E Woodridge Dr
- 8820 N Old State 37 Rd
- 3334 E Bethel Ln
- 6035 Nehrt Rd
- 290 E Sample Rd
- 284 E Sample Rd
- 871 E Sample Rd
- 785 E Sample Rd
- None E Sample
- 4.67 Acres E Sample Rd
- 761 E Sample Rd
- 920 E Sample Rd
- 740 E Sample Rd
- 661 E Sample Rd
- 1125 E Sample Rd
- 660 E Sample Rd
- 571 E Sample Rd
- 583 E Sample Rd
- 581 E Sample Rd
- 1150 E Sample Rd
- 455 E Sample Rd
- 846 E Sample Rd
- 1201 E Sample Rd
- 573 E Sample Rd
Your Personal Tour Guide
Ask me questions while you tour the home.