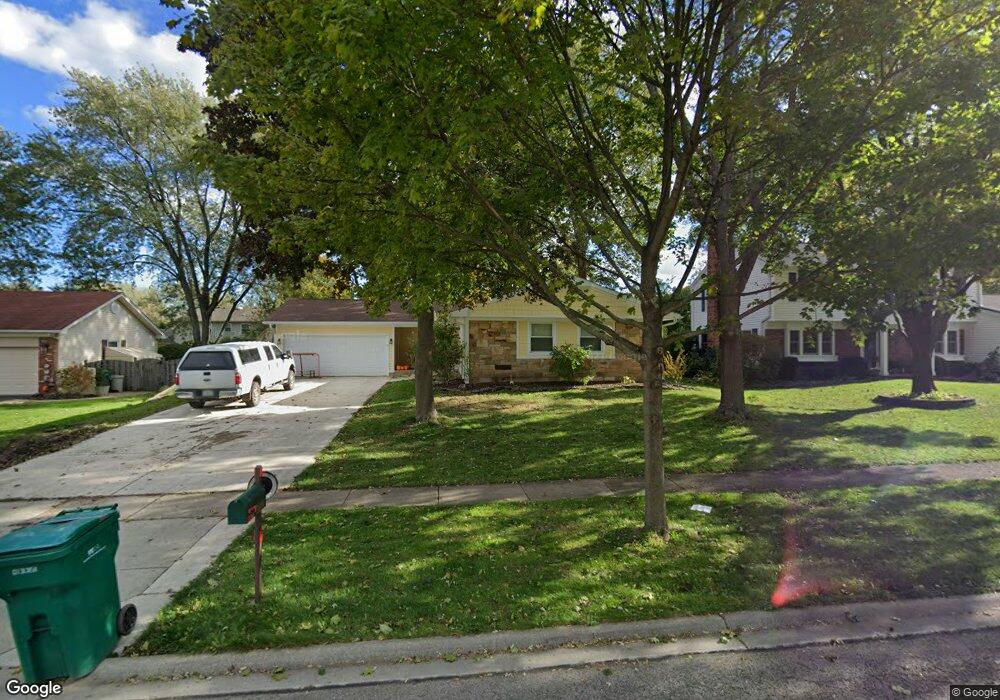
860 Hollystone Ln Buffalo Grove, IL 60089
Estimated Value: $456,000 - $527,000
--
Bed
2
Baths
2,056
Sq Ft
$233/Sq Ft
Est. Value
About This Home
This home is located at 860 Hollystone Ln, Buffalo Grove, IL 60089 and is currently estimated at $478,661, approximately $232 per square foot. 860 Hollystone Ln is a home located in Lake County with nearby schools including Ivy Hall Elementary School, Twin Groves Middle School, and Adlai E Stevenson High School.
Ownership History
Date
Name
Owned For
Owner Type
Purchase Details
Closed on
Feb 18, 2019
Sold by
Dubin William and Dubin Susan
Bought by
Dubin William Ian and Dubin Susan Ilene
Current Estimated Value
Purchase Details
Closed on
Jul 16, 2002
Sold by
Kastler Michael D and Kastler Mary S
Bought by
Dubin William and Dubin Susan
Home Financials for this Owner
Home Financials are based on the most recent Mortgage that was taken out on this home.
Original Mortgage
$208,000
Interest Rate
6.62%
Purchase Details
Closed on
Oct 27, 1998
Sold by
Jacques Richard J and Jacques Renee
Bought by
Kastler Michael D and Kastler Mary S
Home Financials for this Owner
Home Financials are based on the most recent Mortgage that was taken out on this home.
Original Mortgage
$136,875
Interest Rate
6.59%
Create a Home Valuation Report for This Property
The Home Valuation Report is an in-depth analysis detailing your home's value as well as a comparison with similar homes in the area
Home Values in the Area
Average Home Value in this Area
Purchase History
| Date | Buyer | Sale Price | Title Company |
|---|---|---|---|
| Dubin William Ian | -- | None Available | |
| Dubin William Ian | -- | None Available | |
| Dubin William | $260,000 | First American Title | |
| Kastler Michael D | $182,500 | -- |
Source: Public Records
Mortgage History
| Date | Status | Borrower | Loan Amount |
|---|---|---|---|
| Previous Owner | Dubin William | $208,000 | |
| Previous Owner | Kastler Michael D | $136,875 |
Source: Public Records
Tax History Compared to Growth
Tax History
| Year | Tax Paid | Tax Assessment Tax Assessment Total Assessment is a certain percentage of the fair market value that is determined by local assessors to be the total taxable value of land and additions on the property. | Land | Improvement |
|---|---|---|---|---|
| 2024 | $11,358 | $125,827 | $35,615 | $90,212 |
| 2023 | $10,793 | $118,727 | $33,605 | $85,122 |
| 2022 | $10,793 | $109,504 | $30,994 | $78,510 |
| 2021 | $10,382 | $108,323 | $30,660 | $77,663 |
| 2020 | $11,123 | $118,669 | $30,765 | $87,904 |
| 2019 | $10,924 | $118,232 | $30,652 | $87,580 |
| 2018 | $8,658 | $110,289 | $30,294 | $79,995 |
| 2017 | $9,647 | $107,715 | $29,587 | $78,128 |
| 2016 | $9,696 | $106,293 | $28,332 | $77,961 |
| 2015 | $9,434 | $99,003 | $26,495 | $72,508 |
| 2014 | $7,405 | $77,947 | $28,456 | $49,491 |
| 2012 | $7,333 | $78,103 | $28,513 | $49,590 |
Source: Public Records
Map
Nearby Homes
- 610 Checker Dr
- 800 Clohesey Dr
- 390 Springside Ln
- 711 Woodhollow Ln
- 931 Shady Grove Ln
- 950 Belmar Ln
- 746 Old Checker Rd Unit E5
- 412 Chateau Dr
- 1141 Devonshire Rd
- 12 Cloverdale Ct
- 310 Lakeview Ct
- 1112 Auburn Ln
- 221 Thornapple Ct
- 887 Saybrook Ln Unit 2
- 1152 Courtland Dr Unit 406
- 1032 Courtland Dr Unit 9
- 1265 Devonshire Rd
- 603 Cherbourg Ct N
- 1113 Lockwood Dr
- 1325 Fairfax Ln
- 870 Hollystone Ln
- 850 Hollystone Ln
- 831 Westbourne Ln
- 841 Westbourne Ln
- 821 Westbourne Ln
- 880 Hollystone Ln
- 641 Twisted Oak Ln
- 881 Hollystone Ln
- 851 Westbourne Ln Unit 6
- 890 Hollystone Ln
- 621 Twisted Oak Ln
- 891 Hollystone Ln
- 891 Holly Stone Ln
- 861 Westbourne Ln
- 670 Twisted Oak Ln
- 680 Twisted Oak Ln
- 660 Twisted Oak Ln
- 690 Twisted Oak Ln
- 830 Westbourne Ln
- 611 Twisted Oak Ln