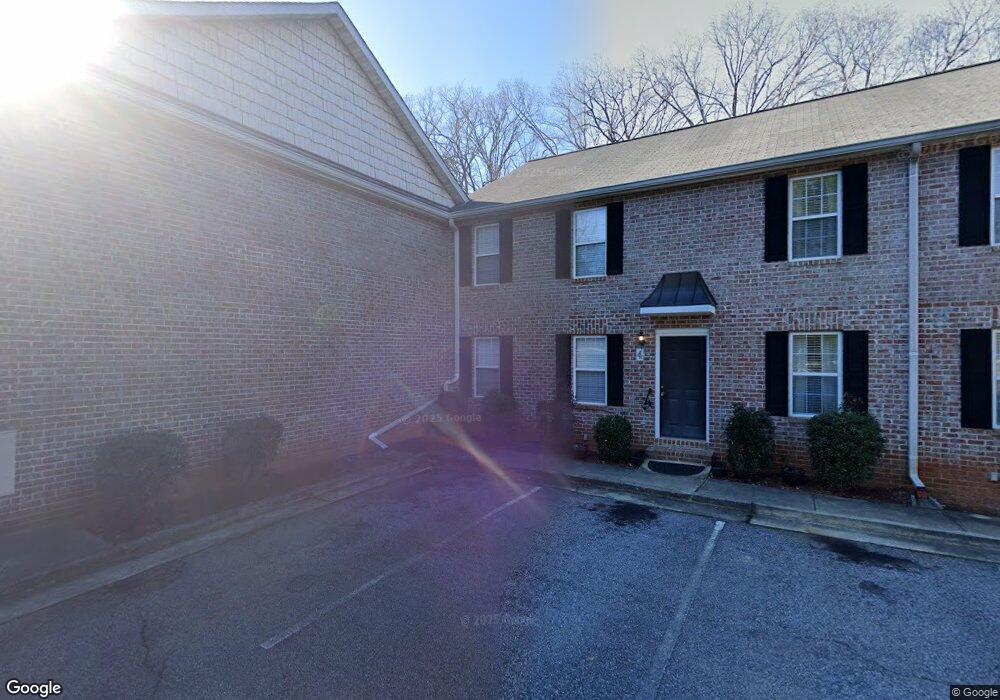
860 Mitchell Bridge Rd Athens, GA 30606
Estimated Value: $278,000 - $380,000
Studio
1
Bath
1,496
Sq Ft
$221/Sq Ft
Est. Value
About This Home
This home is located at 860 Mitchell Bridge Rd, Athens, GA 30606 and is currently estimated at $331,274, approximately $221 per square foot. 860 Mitchell Bridge Rd is a home located in Clarke County with nearby schools including Timothy Elementary School, Clarke Middle School, and Clarke Central High School.
Ownership History
Date
Name
Owned For
Owner Type
Purchase Details
Closed on
May 12, 2006
Sold by
Not Provided
Bought by
Castlejohn Alex Christina A Ca
Current Estimated Value
Home Financials for this Owner
Home Financials are based on the most recent Mortgage that was taken out on this home.
Original Mortgage
$121,600
Interest Rate
6.41%
Mortgage Type
New Conventional
Purchase Details
Closed on
Mar 14, 2006
Sold by
Not Provided
Bought by
Castlejohn Alex Christina A Ca
Home Financials for this Owner
Home Financials are based on the most recent Mortgage that was taken out on this home.
Original Mortgage
$121,600
Interest Rate
6.41%
Mortgage Type
New Conventional
Purchase Details
Closed on
Mar 4, 2005
Sold by
Barbre Melody C
Bought by
Meeker Barbara Elaine
Purchase Details
Closed on
Nov 2, 2001
Sold by
Jack Pearson Construction Inc
Bought by
Berbre Melody C and Blake Barbre J
Create a Home Valuation Report for This Property
The Home Valuation Report is an in-depth analysis detailing your home's value as well as a comparison with similar homes in the area
Purchase History
| Date | Buyer | Sale Price | Title Company |
|---|---|---|---|
| Castlejohn Alex Christina A Ca | $152,000 | -- | |
| Castlejohn Alex Christina A Ca | -- | -- | |
| Meeker Barbara Elaine | $140,000 | -- | |
| Berbre Melody C | $130,000 | -- |
Source: Public Records
Mortgage History
| Date | Status | Borrower | Loan Amount |
|---|---|---|---|
| Closed | Castlejohn Alex Christina A Ca | $121,600 |
Source: Public Records
Tax History
| Year | Tax Paid | Tax Assessment Tax Assessment Total Assessment is a certain percentage of the fair market value that is determined by local assessors to be the total taxable value of land and additions on the property. | Land | Improvement |
|---|---|---|---|---|
| 2025 | $3,266 | $105,193 | $14,000 | $91,193 |
| 2024 | $3,266 | $102,326 | $14,000 | $88,326 |
| 2023 | $3,198 | $93,138 | $14,000 | $79,138 |
| 2022 | $2,102 | $65,883 | $14,000 | $51,883 |
| 2021 | $2,158 | $64,022 | $14,000 | $50,022 |
| 2020 | $1,888 | $56,013 | $14,000 | $42,013 |
| 2019 | $1,862 | $54,836 | $14,000 | $40,836 |
| 2018 | $1,837 | $54,101 | $14,000 | $40,101 |
| 2017 | $1,827 | $53,828 | $14,000 | $39,828 |
| 2016 | $1,826 | $53,792 | $14,000 | $39,792 |
| 2015 | $1,834 | $53,945 | $14,000 | $39,945 |
| 2014 | $1,852 | $54,404 | $14,000 | $40,404 |
Source: Public Records
Map
Nearby Homes
- 860 Mitchell Bridge Rd Unit 8
- 306 Providence Rd
- 164 Lucy Ln
- 118 Woodhaven Terrace
- 150 The Preserve Dr Unit H2
- 400 Providence Rd
- 236 Melba Ln
- 128 Russell Way
- 175 New Haven Dr
- 134 Bent Tree Dr
- 184 Hillsborough Dr
- 145 Heyward Allen Pkwy
- 125 Pine Tops Dr
- 256 Cherokee Ridge
- 655 Rivermont Rd
- 575 Vaughn Rd
- 158 Mallard Pointe Way
- 292 Wood Lake Dr
- 470 Huntington Rd Unit 5
- 304 Wood Lake Dr
- 860 Mitchell Bridge Rd Unit 7
- 860 Mitchell Bridge Rd Unit 3
- 860 Mitchell Bridge Rd Unit 4
- 860 Mitchell Bridge Rd Unit 8
- 860 Mitchell Bridge Rd Unit 6
- 860 Mitchell Bridge Rd Unit 1
- 860 Mitchell Bridge Rd Unit 5
- 860 Mitchell Bridge Rd Unit 2
- 860 Mitchell Bridge Rd
- 860 Mitchell Bridge Rd
- 860 Mitchell Bridge Rd
- 860 Mitchell Bridge Rd
- 860 Mitchell Bridge Rd
- 860 Mitchell Bridge Rd
- 860 Mitchell Bridge Rd
- 175 Chapel Hill Way
- 107 Lucy Ln
- 101 Lucy Ln
- 865 Mitchell Bridge Rd
- 113 Lucy Ln
Your Personal Tour Guide
Ask me questions while you tour the home.