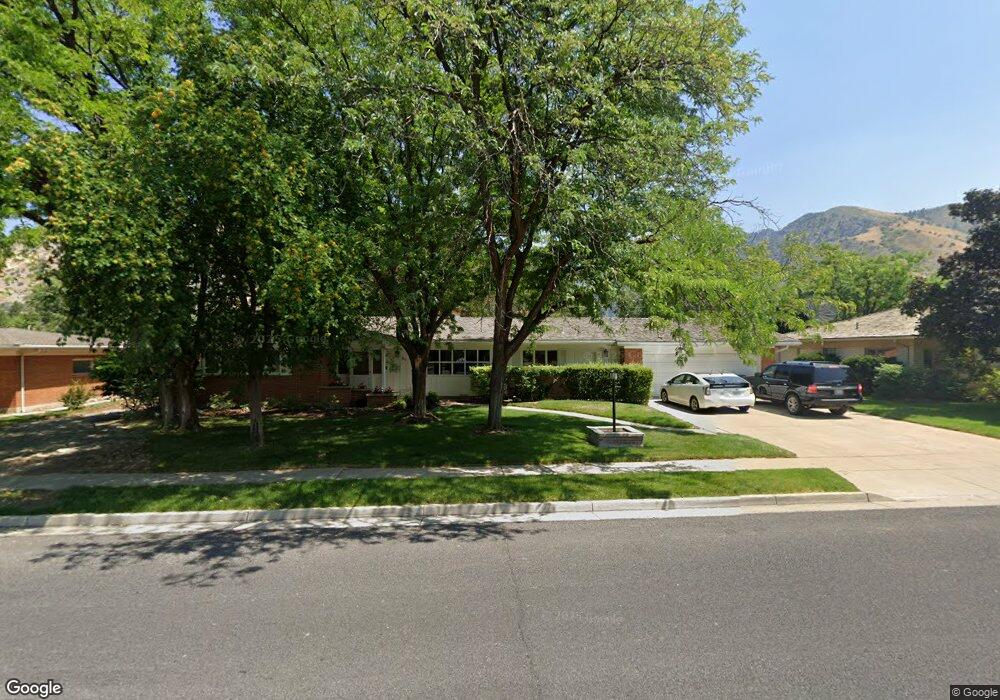
860 N 1500 E Logan, UT 84321
Hillcrest NeighborhoodEstimated Value: $685,778 - $880,000
Studio
--
Bath
3,170
Sq Ft
$247/Sq Ft
Est. Value
About This Home
This home is located at 860 N 1500 E, Logan, UT 84321 and is currently estimated at $782,695, approximately $246 per square foot. 860 N 1500 E is a home with nearby schools including Hillcrest Elementary School, Mount Logan Middle School, and Logan High School.
Ownership History
Date
Name
Owned For
Owner Type
Purchase Details
Closed on
Aug 13, 2024
Sold by
Christensen David M and Christensen Mara R
Bought by
Christensen David M and Christensen Mara
Current Estimated Value
Home Financials for this Owner
Home Financials are based on the most recent Mortgage that was taken out on this home.
Original Mortgage
$560,000
Outstanding Balance
$551,743
Interest Rate
6.95%
Mortgage Type
New Conventional
Estimated Equity
$230,952
Purchase Details
Closed on
Aug 28, 2018
Sold by
Watts Calvin R and Baskin Lisa J Watts
Bought by
Christensen David M and Christensen Mara R
Home Financials for this Owner
Home Financials are based on the most recent Mortgage that was taken out on this home.
Original Mortgage
$310,500
Interest Rate
4.5%
Mortgage Type
New Conventional
Purchase Details
Closed on
Mar 13, 2005
Sold by
Watts Calvin R and Watts Annamae A
Bought by
Watts Anna Mae and Watts Calvin R
Create a Home Valuation Report for This Property
The Home Valuation Report is an in-depth analysis detailing your home's value as well as a comparison with similar homes in the area
Home Values in the Area
Average Home Value in this Area
Purchase History
| Date | Buyer | Sale Price | Title Company |
|---|---|---|---|
| Christensen David M | -- | Meridian Title | |
| Christensen David M | -- | Hickman Land Title Co | |
| Watts Anna Mae | -- | None Available |
Source: Public Records
Mortgage History
| Date | Status | Borrower | Loan Amount |
|---|---|---|---|
| Open | Christensen David M | $560,000 | |
| Previous Owner | Christensen David M | $310,500 |
Source: Public Records
Tax History
| Year | Tax Paid | Tax Assessment Tax Assessment Total Assessment is a certain percentage of the fair market value that is determined by local assessors to be the total taxable value of land and additions on the property. | Land | Improvement |
|---|---|---|---|---|
| 2025 | $3,272 | $423,235 | $0 | $0 |
| 2024 | $3,364 | $421,390 | $0 | $0 |
| 2023 | $2,992 | $357,220 | $0 | $0 |
| 2022 | $3,204 | $357,215 | $0 | $0 |
| 2021 | $2,680 | $461,620 | $62,000 | $399,620 |
| 2020 | $2,383 | $369,400 | $62,000 | $307,400 |
| 2019 | $2,490 | $369,400 | $62,000 | $307,400 |
| 2018 | $2,027 | $274,464 | $62,000 | $212,464 |
| 2017 | $1,933 | $138,435 | $0 | $0 |
| 2016 | $2,005 | $132,110 | $0 | $0 |
| 2015 | $1,915 | $132,110 | $0 | $0 |
| 2014 | $1,731 | $132,110 | $0 | $0 |
| 2013 | -- | $122,415 | $0 | $0 |
Source: Public Records
Map
Nearby Homes
- 1441 Ellendale Ave
- 866 Hillcrest Ave
- 871 Hillcrest Ave
- 909 Evergreen Dr
- 1133 N 1520 E
- 1512 E 1260 N
- 1156 Circle View Dr
- 1246 Canyon Rd
- 1535 E 1385 N
- 1335 N 1275 Ln E Unit 55
- 327 N 1430 E
- 1341 N 1250 E Unit 41
- 1354 N 1250 E Unit 46
- 1424 N 1640 E
- 1352 N Talmage Ln
- 1352 N Talmage Ln Unit 36
- 1440 N 1600 E
- 1454 N 1400 E
- 1374 N 1250 E Unit 48
- 1551 E 1455 N
Your Personal Tour Guide
Ask me questions while you tour the home.