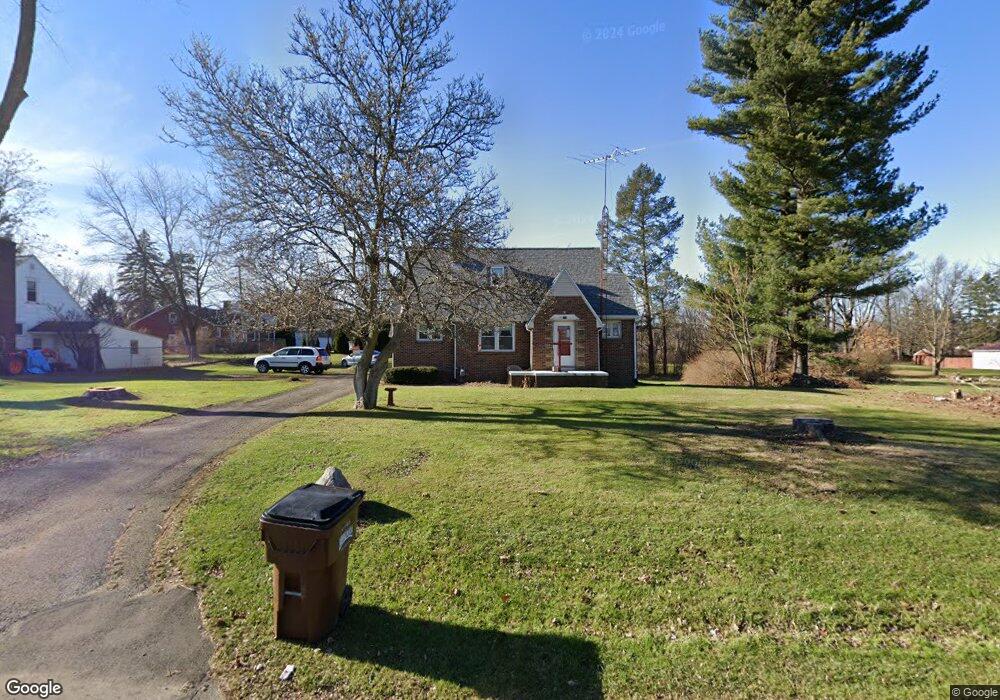
860 S Main St Mansfield, OH 44907
Estimated Value: $150,631 - $199,000
3
Beds
1
Bath
1,529
Sq Ft
$113/Sq Ft
Est. Value
About This Home
This home is located at 860 S Main St, Mansfield, OH 44907 and is currently estimated at $172,658, approximately $112 per square foot. 860 S Main St is a home located in Richland County with nearby schools including Madison High School, St. Peter's Elementary/Montessori School, and Mansfield Christian School.
Ownership History
Date
Name
Owned For
Owner Type
Purchase Details
Closed on
May 13, 2004
Sold by
Oxford Gerald E
Bought by
Cobb George D and Cobb Cheryl A
Current Estimated Value
Home Financials for this Owner
Home Financials are based on the most recent Mortgage that was taken out on this home.
Original Mortgage
$66,500
Outstanding Balance
$30,035
Interest Rate
5.63%
Mortgage Type
Purchase Money Mortgage
Estimated Equity
$142,623
Purchase Details
Closed on
May 27, 1999
Sold by
Fry Ophelia S
Bought by
Oxford Gerald E
Home Financials for this Owner
Home Financials are based on the most recent Mortgage that was taken out on this home.
Original Mortgage
$84,390
Interest Rate
6.92%
Mortgage Type
New Conventional
Purchase Details
Closed on
May 25, 1995
Sold by
Est Mary Jane Wilson
Bought by
Fry Ophelia S
Home Financials for this Owner
Home Financials are based on the most recent Mortgage that was taken out on this home.
Original Mortgage
$40,000
Interest Rate
8.01%
Mortgage Type
New Conventional
Purchase Details
Closed on
Apr 14, 1994
Sold by
Wilson Woodrow
Bought by
Wilson Mary Jane
Create a Home Valuation Report for This Property
The Home Valuation Report is an in-depth analysis detailing your home's value as well as a comparison with similar homes in the area
Home Values in the Area
Average Home Value in this Area
Purchase History
| Date | Buyer | Sale Price | Title Company |
|---|---|---|---|
| Cobb George D | $71,900 | Chicago Title | |
| Oxford Gerald E | $87,000 | -- | |
| Fry Ophelia S | $50,000 | -- | |
| Wilson Mary Jane | -- | -- |
Source: Public Records
Mortgage History
| Date | Status | Borrower | Loan Amount |
|---|---|---|---|
| Open | Cobb George D | $66,500 | |
| Closed | Oxford Gerald E | $84,390 | |
| Previous Owner | Fry Ophelia S | $40,000 |
Source: Public Records
Tax History
| Year | Tax Paid | Tax Assessment Tax Assessment Total Assessment is a certain percentage of the fair market value that is determined by local assessors to be the total taxable value of land and additions on the property. | Land | Improvement |
|---|---|---|---|---|
| 2025 | $1,357 | $40,020 | $9,530 | $30,490 |
| 2024 | $1,357 | $40,020 | $9,530 | $30,490 |
| 2023 | $1,415 | $40,020 | $9,530 | $30,490 |
| 2022 | $1,135 | $29,070 | $8,180 | $20,890 |
| 2021 | $1,636 | $29,070 | $8,180 | $20,890 |
| 2020 | $1,672 | $29,070 | $8,180 | $20,890 |
| 2019 | $1,574 | $24,690 | $6,930 | $17,760 |
| 2018 | $1,553 | $24,690 | $6,930 | $17,760 |
| 2017 | $1,476 | $24,690 | $6,930 | $17,760 |
| 2016 | $1,441 | $22,830 | $6,720 | $16,110 |
| 2015 | $1,376 | $22,830 | $6,720 | $16,110 |
| 2014 | $1,653 | $27,790 | $6,720 | $21,070 |
| 2012 | $649 | $28,650 | $6,930 | $21,720 |
Source: Public Records
Map
Nearby Homes
- 70 Ridgewood Blvd
- 204 Cherry Hill Rd
- 69 Chilton Ave
- 226 Cliffbrook Dr
- 61 Mccullough Blvd Unit 45
- 665 Gilbert Ave
- 34 W Raleigh Ave
- 104 Elmridge Rd
- 571 Luther St
- 86 Sherbrook Rd
- 178 Chilton Ave
- 1200 S Main St
- 578 Harter Ave
- 851 Danwood Ave
- 475 Beethoven St
- 466 Lexington Ave
- 540 Lexington Ave
- 469 Crescent Rd
- 394 S Main St
- 575 Crescent Rd
Your Personal Tour Guide
Ask me questions while you tour the home.