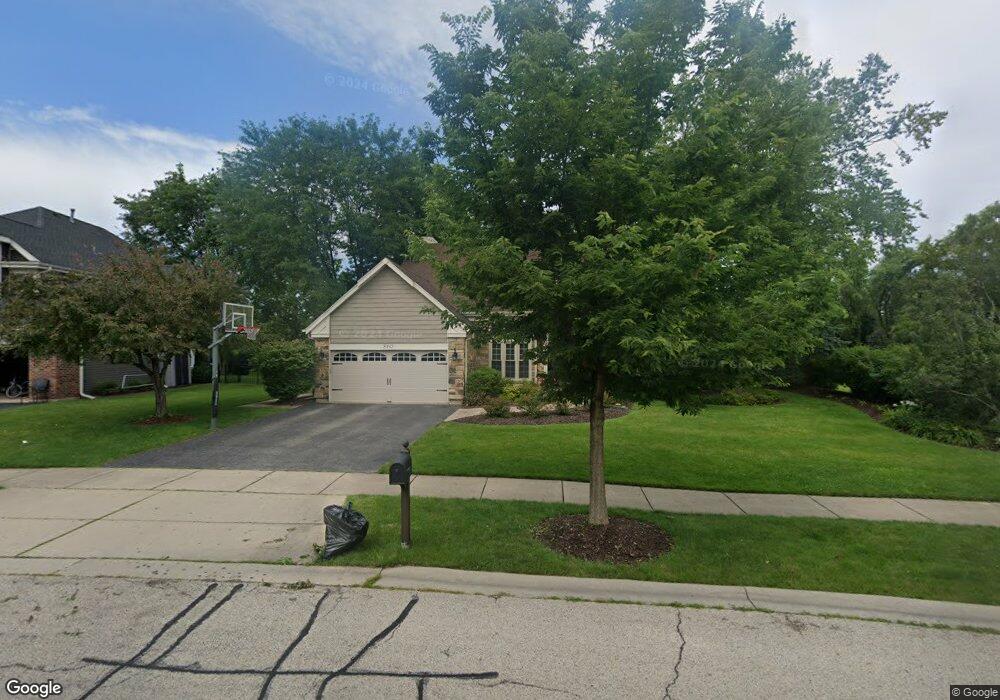
860 Warwick Ln Unit 4 Lake Zurich, IL 60047
Estimated Value: $697,000 - $739,000
4
Beds
3
Baths
2,850
Sq Ft
$253/Sq Ft
Est. Value
About This Home
This home is located at 860 Warwick Ln Unit 4, Lake Zurich, IL 60047 and is currently estimated at $720,506, approximately $252 per square foot. 860 Warwick Ln Unit 4 is a home located in Lake County with nearby schools including May Whitney Elementary School, Lake Zurich Middle School - South Campus, and Lake Zurich High School.
Ownership History
Date
Name
Owned For
Owner Type
Purchase Details
Closed on
Aug 17, 2011
Sold by
Canger John and Canger Lynda
Bought by
Miles Mark A and Miles Tammi Sue
Current Estimated Value
Home Financials for this Owner
Home Financials are based on the most recent Mortgage that was taken out on this home.
Original Mortgage
$375,200
Outstanding Balance
$260,026
Interest Rate
4.59%
Mortgage Type
New Conventional
Estimated Equity
$460,480
Purchase Details
Closed on
Jun 21, 2002
Sold by
Rubak Christopher G and Rubak Betsy H
Bought by
Canger John and Canger Lynda
Home Financials for this Owner
Home Financials are based on the most recent Mortgage that was taken out on this home.
Original Mortgage
$100,000
Interest Rate
6.8%
Create a Home Valuation Report for This Property
The Home Valuation Report is an in-depth analysis detailing your home's value as well as a comparison with similar homes in the area
Home Values in the Area
Average Home Value in this Area
Purchase History
| Date | Buyer | Sale Price | Title Company |
|---|---|---|---|
| Miles Mark A | $469,000 | Baird & Warner Title Service | |
| Canger John | $420,000 | -- |
Source: Public Records
Mortgage History
| Date | Status | Borrower | Loan Amount |
|---|---|---|---|
| Open | Miles Mark A | $375,200 | |
| Previous Owner | Canger John | $100,000 |
Source: Public Records
Tax History Compared to Growth
Tax History
| Year | Tax Paid | Tax Assessment Tax Assessment Total Assessment is a certain percentage of the fair market value that is determined by local assessors to be the total taxable value of land and additions on the property. | Land | Improvement |
|---|---|---|---|---|
| 2024 | $13,871 | $204,564 | $33,609 | $170,955 |
| 2023 | $13,871 | $184,323 | $30,283 | $154,040 |
| 2022 | $12,688 | $167,050 | $30,870 | $136,180 |
| 2021 | $12,252 | $162,769 | $30,079 | $132,690 |
| 2020 | $12,030 | $162,769 | $30,079 | $132,690 |
| 2019 | $11,846 | $161,350 | $29,817 | $131,533 |
| 2018 | $12,563 | $171,271 | $32,080 | $139,191 |
| 2017 | $12,572 | $169,206 | $31,693 | $137,513 |
| 2016 | $12,238 | $163,848 | $30,689 | $133,159 |
| 2015 | $12,071 | $156,060 | $29,230 | $126,830 |
| 2014 | $11,628 | $148,943 | $30,812 | $118,131 |
| 2012 | $11,313 | $149,257 | $30,877 | $118,380 |
Source: Public Records
Map
Nearby Homes
- 1148 Oxford Ln
- 21704 N Pine Grove Ct
- 1266 Thorndale Ln
- 1214 Eric Ln
- 1215 William Dr
- 815 Pheasant Ridge Dr
- 21725 N Ashley St
- 22292 N Prairie Ln
- 792 Ravenswood Ct
- 21326 N Elder Ct
- 822 Woodbine Cir
- 21742 N Ashley St
- 21744 N Hickory Hill Dr
- 20992 W Preserve Dr
- 22145 W White Pine Rd
- 21186 W Preserve Dr
- 21265 W East Cuba Rd
- 370 Hobble Bush Dr
- 21846 N Hickory Hill Dr
- 21956 N Hickory Hill Dr
- 866 Warwick Ln
- 856 Warwick Ln
- 22102 Cambridge Dr
- 859 Warwick Ln
- 872 Warwick Ln
- 855 Warwick Ln
- 865 Warwick Ln
- 848 Warwick Ln
- 851 Warwick Ln
- 22110 Cambridge Dr
- 21727 N Timber Ridge Ct
- 847 Warwick Ln
- 880 Warwick Ln
- 844 Warwick Ln
- 1323 Thorndale Ln
- 875 Warwick Ln
- 886 Warwick Ln
- 1319 Thorndale Ln
- 843 Warwick Ln
- 892 Warwick Ln