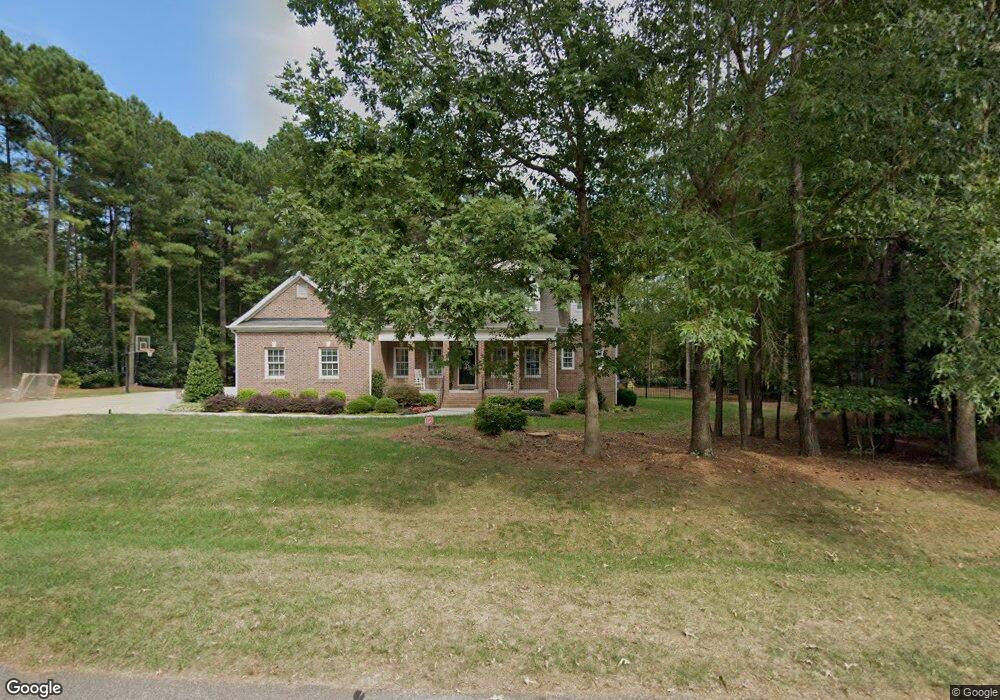
8600 Territory Trail Wake Forest, NC 27587
Falls Lake NeighborhoodEstimated Value: $732,000 - $850,000
4
Beds
4
Baths
3,661
Sq Ft
$214/Sq Ft
Est. Value
About This Home
This home is located at 8600 Territory Trail, Wake Forest, NC 27587 and is currently estimated at $784,436, approximately $214 per square foot. 8600 Territory Trail is a home located in Wake County with nearby schools including Pleasant Union Elementary School, Wakefield Middle, and Wakefield High School.
Ownership History
Date
Name
Owned For
Owner Type
Purchase Details
Closed on
Mar 14, 2014
Sold by
Fannie Mae
Bought by
Bristow James L and Bristow Leslie B
Current Estimated Value
Home Financials for this Owner
Home Financials are based on the most recent Mortgage that was taken out on this home.
Original Mortgage
$289,750
Outstanding Balance
$219,537
Interest Rate
4.33%
Mortgage Type
New Conventional
Estimated Equity
$564,899
Purchase Details
Closed on
Jul 19, 2013
Sold by
Reese Troynell and Reese Sherri
Bought by
Federal National Mortgage Association
Purchase Details
Closed on
Jul 2, 2004
Sold by
Abraham Robert B and Abraham Patricia A
Bought by
Reese Troynell and Reese Sherri
Home Financials for this Owner
Home Financials are based on the most recent Mortgage that was taken out on this home.
Original Mortgage
$300,000
Interest Rate
5.12%
Mortgage Type
Purchase Money Mortgage
Purchase Details
Closed on
Nov 29, 2001
Sold by
Sutherland Investment Company
Bought by
Abraham Robert B
Create a Home Valuation Report for This Property
The Home Valuation Report is an in-depth analysis detailing your home's value as well as a comparison with similar homes in the area
Home Values in the Area
Average Home Value in this Area
Purchase History
| Date | Buyer | Sale Price | Title Company |
|---|---|---|---|
| Bristow James L | -- | None Available | |
| Federal National Mortgage Association | -- | None Available | |
| Reese Troynell | $375,000 | -- | |
| Abraham Robert B | $72,500 | -- |
Source: Public Records
Mortgage History
| Date | Status | Borrower | Loan Amount |
|---|---|---|---|
| Open | Bristow James L | $289,750 | |
| Previous Owner | Reese Troynell | $300,000 | |
| Closed | Reese Troynell | $75,000 |
Source: Public Records
Tax History Compared to Growth
Tax History
| Year | Tax Paid | Tax Assessment Tax Assessment Total Assessment is a certain percentage of the fair market value that is determined by local assessors to be the total taxable value of land and additions on the property. | Land | Improvement |
|---|---|---|---|---|
| 2025 | $4,458 | $711,788 | $130,000 | $581,788 |
| 2024 | $4,329 | $693,890 | $130,000 | $563,890 |
| 2023 | $3,571 | $455,434 | $100,000 | $355,434 |
| 2022 | $3,309 | $455,434 | $100,000 | $355,434 |
| 2021 | $3,220 | $455,434 | $100,000 | $355,434 |
| 2020 | $3,167 | $455,434 | $100,000 | $355,434 |
| 2019 | $3,572 | $434,894 | $85,000 | $349,894 |
| 2018 | $3,283 | $434,894 | $85,000 | $349,894 |
| 2017 | $3,112 | $434,894 | $85,000 | $349,894 |
| 2016 | $3,049 | $434,894 | $85,000 | $349,894 |
| 2015 | $3,276 | $468,894 | $120,000 | $348,894 |
| 2014 | $3,105 | $468,894 | $120,000 | $348,894 |
Source: Public Records
Map
Nearby Homes
- 100 Barley Place
- 5313 Purnell Rd
- 5628 Bella Terra Ct
- 9016 New Century Rd
- 6233 Reagan Ln
- 14909 Coveshore Dr
- 8417 Wolverton Fields Dr
- 1217 Mauldin Circle Rd
- 14021 Wallberman Dr
- 4005 Crescent Ridge Dr
- 1028 Harpers Ridge Ct
- 913 Harrison Ridge Rd
- 8021 Bud Morris Rd
- 3186 Buckhorn Ln
- 8017 Bud Morris Rd
- 9604 Challedon Way
- 1124 Kalworth Rd
- 1212 Perry Bluff Dr
- 1220 Perry Bluff Dr
- 1105 Delilia Ln
- 1109 Lake Valley Dr
- 8616 Territory Trail
- 8601 Territory Trail
- 8508 Territory Trail
- 1020 Lake Valley Dr
- 1108 Lake Valley Dr
- 8609 Territory Trail
- 1117 Lake Valley Dr
- 8620 Territory Trail
- 1116 Lake Valley Dr
- 1012 Lake Valley Dr
- 1121 Lake Valley Dr
- 8617 Territory Trail
- 1009 Lake Valley Dr
- 1121 Lake Valley Dr
- 8500 Territory Trail
- 1025 Northlake Ct
- 8621 Territory Trail
- 8621 Territory Trail Unit 90
- 1132 Lake Valley Dr