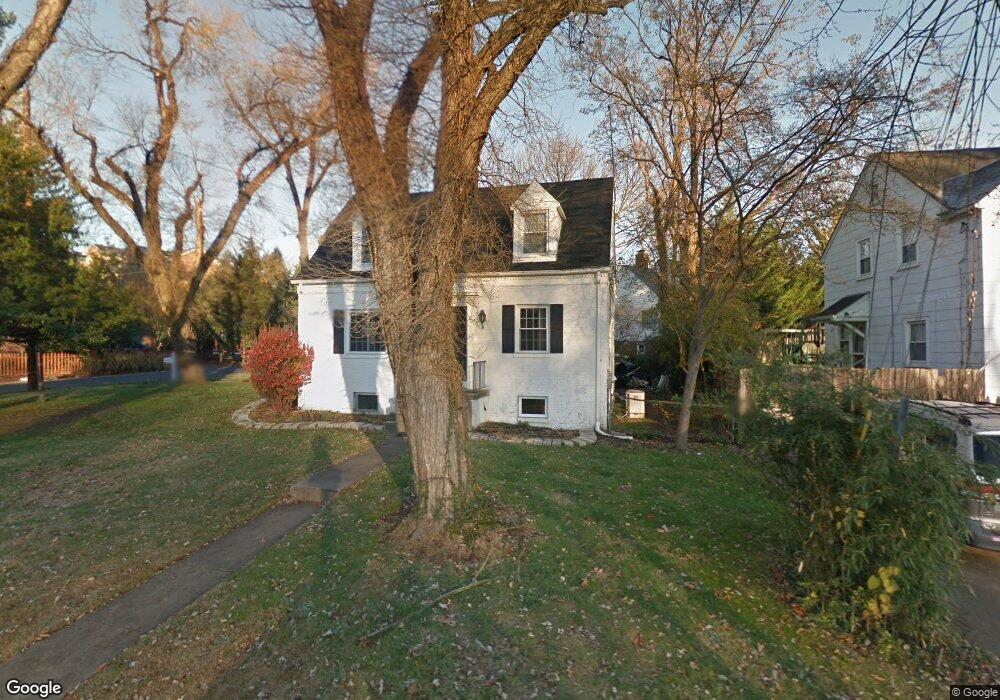
8601 Brandt Place Bethesda, MD 20814
West Chevy Chase Heights NeighborhoodEstimated Value: $943,715 - $1,267,000
--
Bed
2
Baths
1,042
Sq Ft
$1,060/Sq Ft
Est. Value
About This Home
This home is located at 8601 Brandt Place, Bethesda, MD 20814 and is currently estimated at $1,104,679, approximately $1,060 per square foot. 8601 Brandt Place is a home located in Montgomery County with nearby schools including Hoover School, Hughes Elementary School, and Bethesda Elementary School.
Ownership History
Date
Name
Owned For
Owner Type
Purchase Details
Closed on
May 21, 2020
Sold by
Healing Christopher T and Komarova Elena R
Bought by
Healing Christopher T and Healing Elena R
Current Estimated Value
Home Financials for this Owner
Home Financials are based on the most recent Mortgage that was taken out on this home.
Original Mortgage
$535,500
Outstanding Balance
$373,707
Interest Rate
3.2%
Mortgage Type
New Conventional
Estimated Equity
$730,972
Purchase Details
Closed on
Aug 30, 2013
Sold by
Bond Lewis F and Lewis F Bond Iii Revocable Tru
Bought by
Healing Christopher T and Komarova Elena R
Home Financials for this Owner
Home Financials are based on the most recent Mortgage that was taken out on this home.
Original Mortgage
$452,000
Interest Rate
4.43%
Mortgage Type
New Conventional
Purchase Details
Closed on
Oct 13, 1998
Sold by
Lewis F Bond 3Rd
Bought by
Lewis F Bond 3Rd Et Al Tr
Purchase Details
Closed on
Aug 20, 1996
Sold by
U Lewis F and U Bond S
Bought by
Lewis F Bond 3Rd
Create a Home Valuation Report for This Property
The Home Valuation Report is an in-depth analysis detailing your home's value as well as a comparison with similar homes in the area
Home Values in the Area
Average Home Value in this Area
Purchase History
| Date | Buyer | Sale Price | Title Company |
|---|---|---|---|
| Healing Christopher T | -- | Accommodation | |
| Healing Christopher T | $565,000 | None Available | |
| Lewis F Bond 3Rd Et Al Tr | -- | -- | |
| Lewis F Bond 3Rd | -- | -- |
Source: Public Records
Mortgage History
| Date | Status | Borrower | Loan Amount |
|---|---|---|---|
| Open | Healing Christopher T | $535,500 | |
| Closed | Healing Christopher T | $452,000 |
Source: Public Records
Tax History Compared to Growth
Tax History
| Year | Tax Paid | Tax Assessment Tax Assessment Total Assessment is a certain percentage of the fair market value that is determined by local assessors to be the total taxable value of land and additions on the property. | Land | Improvement |
|---|---|---|---|---|
| 2025 | $10,445 | $867,400 | $613,500 | $253,900 |
| 2024 | $10,445 | $843,833 | $0 | $0 |
| 2023 | $9,462 | $820,267 | $0 | $0 |
| 2022 | $8,753 | $796,700 | $557,800 | $238,900 |
| 2021 | $8,598 | $794,300 | $0 | $0 |
| 2020 | $8,598 | $791,900 | $0 | $0 |
| 2019 | $8,535 | $789,500 | $507,100 | $282,400 |
| 2018 | $8,228 | $763,133 | $0 | $0 |
| 2017 | $8,073 | $736,767 | $0 | $0 |
| 2016 | -- | $710,400 | $0 | $0 |
| 2015 | $7,222 | $684,567 | $0 | $0 |
| 2014 | $7,222 | $658,733 | $0 | $0 |
Source: Public Records
Map
Nearby Homes
- 4609 Glenbrook Pkwy
- 4548 Windsor Ln
- 4701 Rosedale Ave
- 4512 Windsor Ln
- 4706 Rosedale Ave
- 4970 Battery Ln Unit 408
- 4977 Battery Ln Unit 319
- 4977 Battery Ln Unit 717
- 5005 Battery Ln Unit 1
- 4801 Fairmont Ave Unit 705
- 7923 Chelton Rd
- 5301 Mckinley St
- 4960 Fairmont Ave Unit 807
- 4960 Fairmont Ave Unit 505
- 4960 Fairmont Ave Unit 904
- 4960 Fairmont Ave Unit 706
- 7819 Exeter Rd
- 7710 Woodmont Ave Unit 911
- 4535 Avondale St
- 4808 Moorland Ln
- 4617 Glenbrook Pkwy
- 8607 Brandt Place
- 4615 Glenbrook Pkwy
- 4701 Glenbrook Pkwy
- 8604 Brandt Place
- 8609 Brandt Place
- 8606 Brandt Place
- 4611 Glenbrook Pkwy
- 4703 Glenbrook Pkwy
- 8611 Brandt Place
- 8608 Brandt Place
- 4700 Monaco Cir
- 4702 Glenbrook Pkwy
- 8610 Brandt Place
- 4700 Glenbrook Pkwy
- 4702 Monaco Cir
- 4704 Glenbrook Pkwy
- 8613 Brandt Place
- 4621 Windsor Ln
- 4704 Monaco Cir