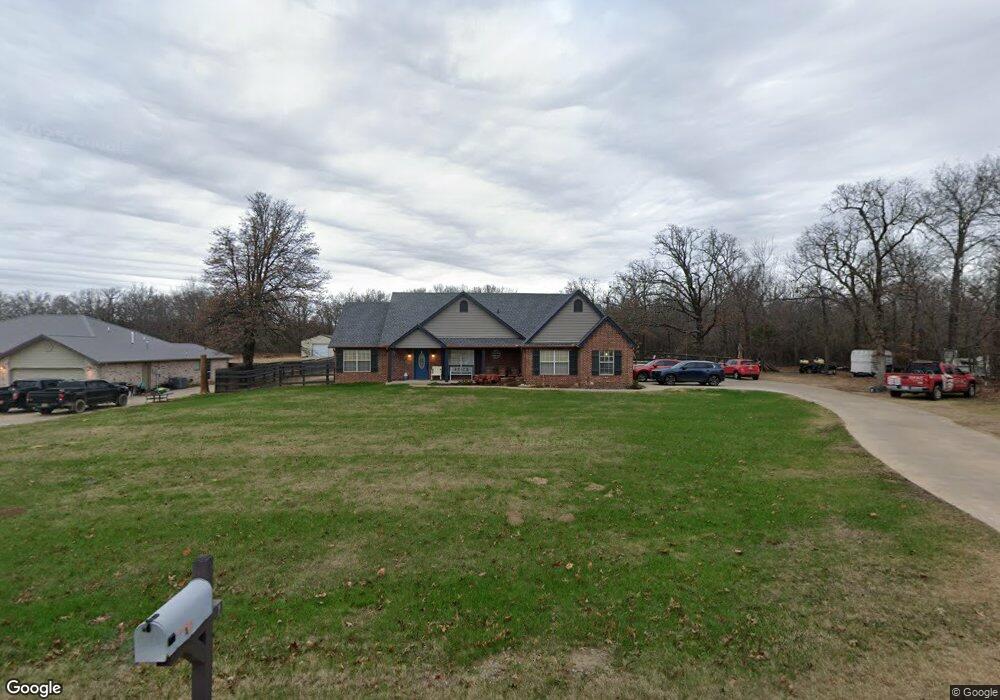
8601 S Ridgeview Dr Sapulpa, OK 74066
Estimated Value: $292,409 - $530,000
3
Beds
2
Baths
2,048
Sq Ft
$188/Sq Ft
Est. Value
About This Home
This home is located at 8601 S Ridgeview Dr, Sapulpa, OK 74066 and is currently estimated at $384,352, approximately $187 per square foot. 8601 S Ridgeview Dr is a home located in Creek County with nearby schools including Lone Star Public School and American Christian Academy.
Ownership History
Date
Name
Owned For
Owner Type
Purchase Details
Closed on
Dec 16, 2005
Sold by
Rupert Chance and Rupert Britney
Bought by
Price Ronnie J and Price Opal L
Current Estimated Value
Home Financials for this Owner
Home Financials are based on the most recent Mortgage that was taken out on this home.
Original Mortgage
$152,500
Outstanding Balance
$84,382
Interest Rate
6.3%
Mortgage Type
New Conventional
Estimated Equity
$299,970
Purchase Details
Closed on
Jun 27, 2005
Sold by
Belk Roger Wesley and Belk Barbara Marie
Bought by
Rupert Chance and Rupert Brittney
Purchase Details
Closed on
Mar 3, 2005
Sold by
Rupert Chance and Rupert Brittney
Bought by
Rupert Chance and Rupert Brittney
Home Financials for this Owner
Home Financials are based on the most recent Mortgage that was taken out on this home.
Original Mortgage
$60,000
Interest Rate
5.71%
Mortgage Type
Credit Line Revolving
Create a Home Valuation Report for This Property
The Home Valuation Report is an in-depth analysis detailing your home's value as well as a comparison with similar homes in the area
Home Values in the Area
Average Home Value in this Area
Purchase History
| Date | Buyer | Sale Price | Title Company |
|---|---|---|---|
| Price Ronnie J | $172,500 | None Available | |
| Rupert Chance | -- | None Available | |
| Rupert Chance | -- | None Available |
Source: Public Records
Mortgage History
| Date | Status | Borrower | Loan Amount |
|---|---|---|---|
| Open | Price Ronnie J | $152,500 | |
| Previous Owner | Rupert Chance | $60,000 |
Source: Public Records
Tax History Compared to Growth
Tax History
| Year | Tax Paid | Tax Assessment Tax Assessment Total Assessment is a certain percentage of the fair market value that is determined by local assessors to be the total taxable value of land and additions on the property. | Land | Improvement |
|---|---|---|---|---|
| 2025 | $2,688 | $30,655 | $3,960 | $26,695 |
| 2024 | $2,519 | $29,763 | $3,960 | $25,803 |
| 2023 | $2,519 | $28,896 | $3,960 | $24,936 |
| 2022 | $2,463 | $28,054 | $3,960 | $24,094 |
| 2021 | $2,393 | $27,252 | $3,821 | $23,431 |
| 2020 | $2,814 | $26,459 | $3,753 | $22,706 |
| 2019 | $2,293 | $25,688 | $3,717 | $21,971 |
| 2018 | $2,179 | $24,213 | $3,464 | $20,749 |
| 2017 | $2,148 | $23,508 | $3,249 | $20,259 |
| 2016 | $2,116 | $22,824 | $3,040 | $19,784 |
| 2015 | -- | $22,159 | $2,837 | $19,322 |
| 2014 | -- | $21,514 | $2,640 | $18,874 |
Source: Public Records
Map
Nearby Homes
- 8801 S Ridgeview Dr
- 8850 W 151st St S
- 15116 S 90th West Ave
- 13623 S 97th Ave W
- 341 N Main St
- 6490 Lindsay Dr
- 16042 S 97th West Ave
- 311 E Indiana
- 8 Ryan Place
- 33 Mary
- 103 E Fairlane Ct
- 10616 W Houston St
- 112 Stark St
- 19 E Fairlane Ct
- 6355 Rockwood Cir N
- 13435 S Garrett St
- 41 W Fairlane Ct
- 2326 S Main St
- 2600 S Hickory St
- 272 W Fairlane Place
- 8609 S Ridgeview Dr
- 8566 S Ridgeview Dr
- 8627 S Ridgeview Dr
- 14000 S Moccasin Place
- 8645 S Ridgeview Dr
- 14721 S Moccasin Place
- 14700 S Moccasin Place
- 14720 S Moccasin Place
- 8681 S Ridgeview Dr
- 14743 S Moccasin Place
- 14740 S Moccasin Place
- 8723 S Ridgeview Dr
- 14773 S Moccasin Place
- 14770 S Moccasin Place
- 8765 S Ridgeview Dr
- 14791 S Moccasin Place
- 8746 S Ridgeview Dr
- 14780 S Moccasin Place
- 3907 S Moccasin Place
- 3829 S Moccasin Place