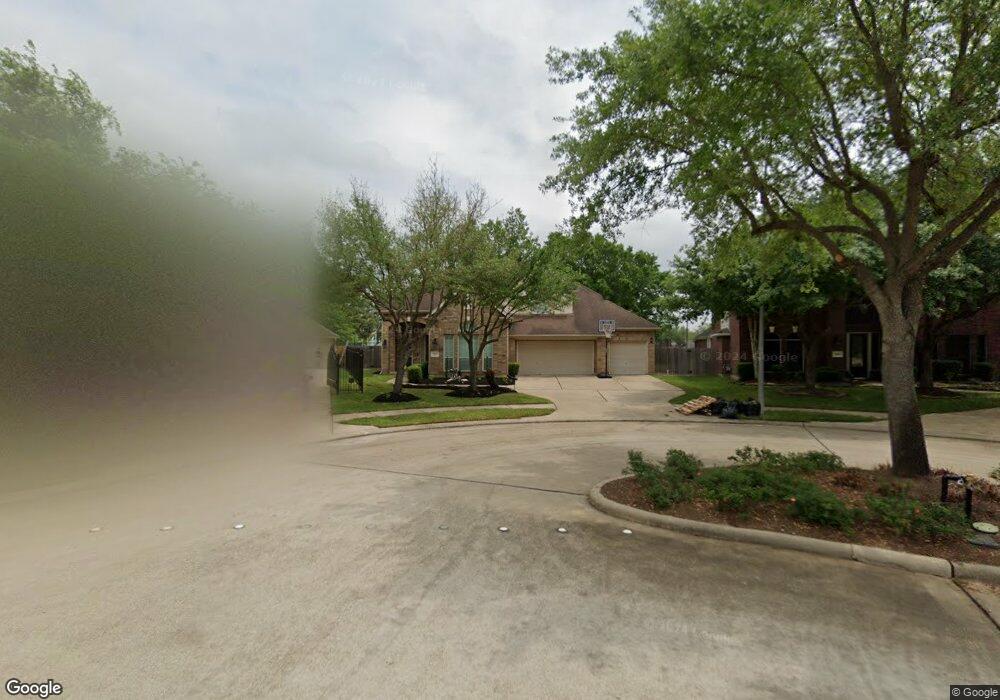
8602 Arranmore Ln Houston, TX 77095
Copperfield NeighborhoodEstimated Value: $429,347 - $461,000
4
Beds
4
Baths
3,276
Sq Ft
$136/Sq Ft
Est. Value
About This Home
This home is located at 8602 Arranmore Ln, Houston, TX 77095 and is currently estimated at $445,587, approximately $136 per square foot. 8602 Arranmore Ln is a home located in Harris County with nearby schools including Birkes Elementary School, Aragon Middle School, and Langham Creek High School.
Ownership History
Date
Name
Owned For
Owner Type
Purchase Details
Closed on
Dec 18, 2018
Sold by
Bentey Leslie
Bought by
Rangel Stella and Rangel Edwin
Current Estimated Value
Purchase Details
Closed on
Feb 28, 2007
Sold by
Cloud Dawn Angel
Bought by
Rangel Edwin
Home Financials for this Owner
Home Financials are based on the most recent Mortgage that was taken out on this home.
Original Mortgage
$184,000
Interest Rate
7.87%
Mortgage Type
Purchase Money Mortgage
Purchase Details
Closed on
Oct 21, 2004
Sold by
Cloud Dawn Angel
Bought by
Cloud Dawn Angel
Purchase Details
Closed on
Feb 17, 2004
Sold by
Hurley Daniel
Bought by
Hurley Daniel
Purchase Details
Closed on
Feb 25, 2000
Sold by
David Powers Homes Le Ltd
Bought by
Hurley Louis C
Home Financials for this Owner
Home Financials are based on the most recent Mortgage that was taken out on this home.
Original Mortgage
$59,632
Interest Rate
8.19%
Create a Home Valuation Report for This Property
The Home Valuation Report is an in-depth analysis detailing your home's value as well as a comparison with similar homes in the area
Home Values in the Area
Average Home Value in this Area
Purchase History
| Date | Buyer | Sale Price | Title Company |
|---|---|---|---|
| Rangel Stella | -- | None Available | |
| Rangel Edwin | -- | American Title Co | |
| Cloud Dawn Angel | -- | -- | |
| Hurley Daniel | -- | -- | |
| Hurley Louis C | -- | Stewart Title |
Source: Public Records
Mortgage History
| Date | Status | Borrower | Loan Amount |
|---|---|---|---|
| Previous Owner | Rangel Edwin | $184,000 | |
| Previous Owner | Hurley Louis C | $59,632 |
Source: Public Records
Tax History Compared to Growth
Tax History
| Year | Tax Paid | Tax Assessment Tax Assessment Total Assessment is a certain percentage of the fair market value that is determined by local assessors to be the total taxable value of land and additions on the property. | Land | Improvement |
|---|---|---|---|---|
| 2025 | $7,010 | $395,592 | $69,472 | $326,120 |
| 2024 | $7,010 | $400,121 | $69,472 | $330,649 |
| 2023 | $7,010 | $402,156 | $69,472 | $332,684 |
| 2022 | $8,622 | $364,176 | $51,532 | $312,644 |
| 2021 | $8,304 | $296,453 | $51,532 | $244,921 |
| 2020 | $7,827 | $271,353 | $42,752 | $228,601 |
| 2019 | $7,547 | $254,472 | $36,645 | $217,827 |
| 2018 | $2,643 | $260,667 | $36,645 | $224,022 |
| 2017 | $7,758 | $260,667 | $36,645 | $224,022 |
| 2016 | $7,172 | $240,982 | $36,645 | $204,337 |
| 2015 | $5,651 | $240,982 | $36,645 | $204,337 |
| 2014 | $5,651 | $224,364 | $36,645 | $187,719 |
Source: Public Records
Map
Nearby Homes
- 16403 Torry View Terrace
- 8619 Arranmore Ln
- 16426 Torry View Terrace
- 16410 Dawnblush Ct
- 8806 Gas Light Village Dr
- 8550 Waiting Spring Ln
- 16511 Crystal View Ct
- 16335 Drystone Ln
- 16611 Gentle Stone Dr
- 16211 Green Smoke Dr
- 8835 Aberdeen Park Dr
- 8426 Laurel Trails Dr
- 16123 Aberdeen Forest Dr
- 16602 Grenada Falls Dr
- 16111 Aberdeen Forest Dr
- 8714 Ridgebury Cir
- 8550 Sparkling Springs Dr
- 16510 Wellers Way
- 8855 Distant Woods Dr
- 16606 Stoneside Dr
- 8606 Arranmore Ln
- 8610 Arranmore Ln
- 16411 Torry View Terrace
- 16410 Torry View Terrace
- 8614 Arranmore Ln
- 16415 Torry View Terrace
- 8618 Arranmore Ln
- 8611 Arranmore Ln
- 8415 Gentlewood Ct
- 8411 Gentlewood Ct
- 8419 Gentlewood Ct
- 8615 Arranmore Ln
- 16418 Torry View Terrace
- 16419 Torry View Terrace
- 8407 Gentlewood Ct
- 8403 Gentlewood Ct
- 16422 Torry View Terrace
- 16423 Torry View Terrace
- 8351 Gentlewood Ct
- 8347 Gentlewood Ct