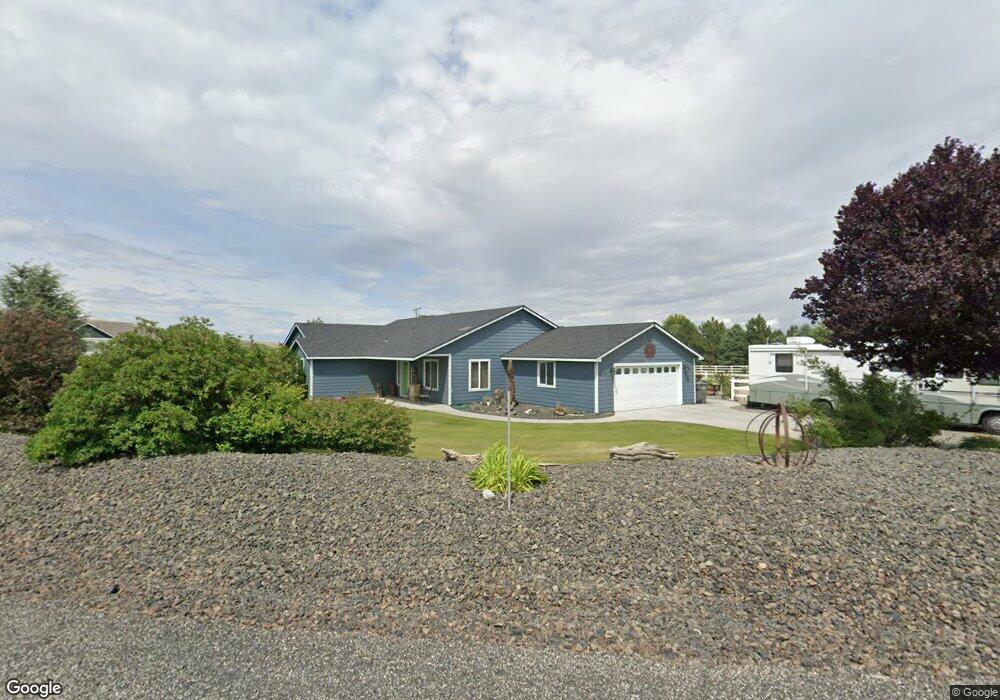
86022 Badger View Dr Kennewick, WA 99338
Estimated Value: $723,427 - $801,000
4
Beds
3
Baths
2,320
Sq Ft
$327/Sq Ft
Est. Value
About This Home
This home is located at 86022 Badger View Dr, Kennewick, WA 99338 and is currently estimated at $757,607, approximately $326 per square foot. 86022 Badger View Dr is a home located in Benton County with nearby schools including Cottonwood Elementary School, Desert Hills Middle School, and Kamiakin High School.
Ownership History
Date
Name
Owned For
Owner Type
Purchase Details
Closed on
May 24, 2012
Sold by
Webber Tamara L and Shockley Tamara L
Bought by
Shockley Paul A and Shockley Tamara L
Current Estimated Value
Home Financials for this Owner
Home Financials are based on the most recent Mortgage that was taken out on this home.
Original Mortgage
$145,000
Outstanding Balance
$100,227
Interest Rate
3.85%
Mortgage Type
Seller Take Back
Estimated Equity
$657,380
Purchase Details
Closed on
Dec 1, 2008
Sold by
Webber Tamara L
Bought by
Webber Tamara L and Shockley Paul A
Home Financials for this Owner
Home Financials are based on the most recent Mortgage that was taken out on this home.
Original Mortgage
$250,000
Outstanding Balance
$164,459
Interest Rate
6.04%
Mortgage Type
Construction
Estimated Equity
$593,148
Purchase Details
Closed on
Aug 19, 2008
Sold by
Potter Guy E
Bought by
Webber Tamara L
Purchase Details
Closed on
Jul 20, 2007
Sold by
Tri City Development Corp
Bought by
Potter Guy E
Create a Home Valuation Report for This Property
The Home Valuation Report is an in-depth analysis detailing your home's value as well as a comparison with similar homes in the area
Home Values in the Area
Average Home Value in this Area
Purchase History
| Date | Buyer | Sale Price | Title Company |
|---|---|---|---|
| Shockley Paul A | -- | Benton Franklin Title Co | |
| Webber Tamara L | -- | Frontier Title & Escrow Co | |
| Webber Tamara L | $68,764 | Cascade Title | |
| Potter Guy E | $68,795 | Stewart Title Co |
Source: Public Records
Mortgage History
| Date | Status | Borrower | Loan Amount |
|---|---|---|---|
| Open | Shockley Paul A | $145,000 | |
| Open | Webber Tamara L | $250,000 |
Source: Public Records
Tax History Compared to Growth
Tax History
| Year | Tax Paid | Tax Assessment Tax Assessment Total Assessment is a certain percentage of the fair market value that is determined by local assessors to be the total taxable value of land and additions on the property. | Land | Improvement |
|---|---|---|---|---|
| 2024 | $5,925 | $610,150 | $229,330 | $380,820 |
| 2023 | $5,925 | $659,630 | $229,330 | $430,300 |
| 2022 | $5,107 | $503,840 | $107,860 | $395,980 |
| 2021 | $4,703 | $468,910 | $107,860 | $361,050 |
| 2020 | $4,754 | $422,320 | $107,860 | $314,460 |
| 2019 | $4,216 | $410,670 | $107,860 | $302,810 |
| 2018 | $4,752 | $375,740 | $107,860 | $267,880 |
| 2017 | $3,696 | $352,440 | $107,860 | $244,580 |
| 2016 | $3,643 | $296,250 | $71,040 | $225,210 |
| 2015 | $3,705 | $288,050 | $71,040 | $217,010 |
| 2014 | -- | $290,210 | $73,200 | $217,010 |
| 2013 | -- | $290,210 | $73,200 | $217,010 |
Source: Public Records
Map
Nearby Homes
- 3682 Morningside Pkwy
- 3721 Morningside Pkwy
- 3735 Morningside Pkwy
- 3791 Morningside Pkwy
- 3646 Morningside Pkwy
- 3725 Nuthatch St
- 3569 Morningside Pkwy
- 9915 S Grandview Ln
- 3733 Nuthatch St
- NKA Savanna Ave Lot 278
- NKA Savanna Ave Lot 277
- NKA Whitesage Ave Lot 273
- NKA Nuthatch Street Lot 261
- NKA Meadowlark Ave Lot 246
- NKA Meadowlark Ave Lot 245
- NKA Meadowlark Ave Lot 234
- NKA
- NKA
- NKA Savanna Ave Lot 288
- NKA Whitesage Avenue Lot 272
- 85604 Badger View Dr
- 85523 Badger View Dr
- 86105 E Reata Rd
- 86221 Badger View Dr
- 86520 Badger View Dr
- 85125 Jenna Ln
- 86503 E Reata Rd
- 85125 Badger View Dr
- 85411 Badger View Dr
- 85126 Jenna Ln
- 85126 Jenna Ln Unit Custom Rambler w/ Sh
- 85423 E Reata Rd
- 85115 E Reata Rd
- 87018 Badger View Dr
- 86917 Badger View Dr
- 84827 Jenna Ln
- 84827 Jenna Ln
- 84719 E Reata Rd
- 82253 E Reata Rd
- 87525 E Reata Rd