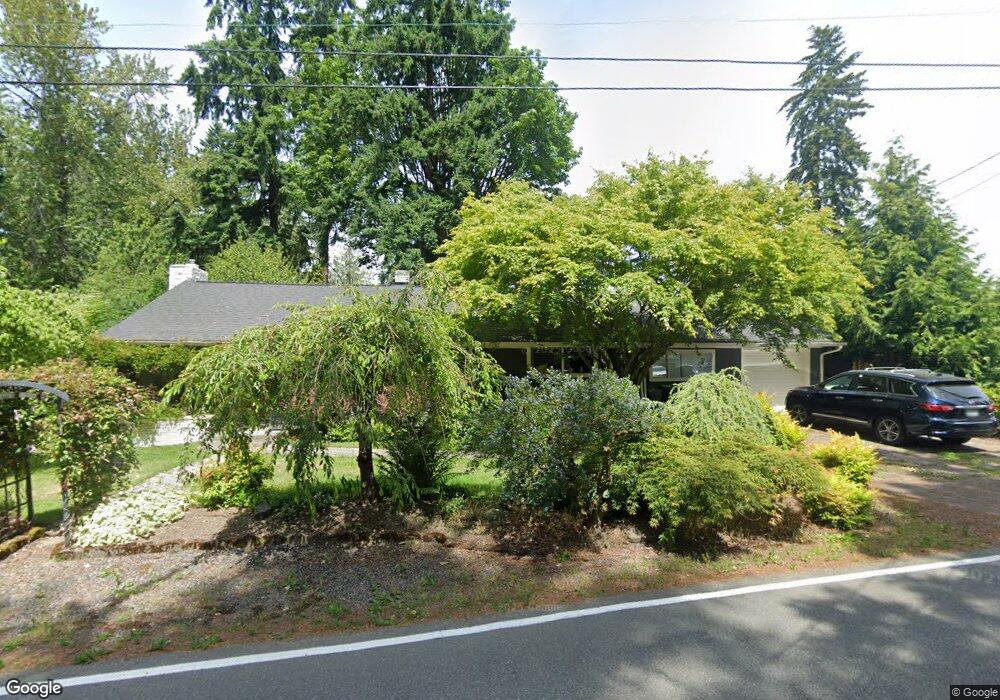
8603 231st St SW Edmonds, WA 98026
Chase Lake NeighborhoodEstimated Value: $808,000 - $995,000
3
Beds
1
Bath
1,656
Sq Ft
$534/Sq Ft
Est. Value
About This Home
This home is located at 8603 231st St SW, Edmonds, WA 98026 and is currently estimated at $884,701, approximately $534 per square foot. 8603 231st St SW is a home located in Snohomish County with nearby schools including Westgate Elementary School, College Place Middle School, and Edmonds-Woodway High School.
Ownership History
Date
Name
Owned For
Owner Type
Purchase Details
Closed on
Oct 5, 2004
Sold by
Bilanski Brian L
Bought by
Bilanski Christina S
Current Estimated Value
Home Financials for this Owner
Home Financials are based on the most recent Mortgage that was taken out on this home.
Original Mortgage
$170,000
Outstanding Balance
$77,640
Interest Rate
4.62%
Mortgage Type
Purchase Money Mortgage
Estimated Equity
$807,061
Purchase Details
Closed on
Jun 5, 1998
Sold by
Adams Ralph E
Bought by
Adams Rebecca E
Home Financials for this Owner
Home Financials are based on the most recent Mortgage that was taken out on this home.
Original Mortgage
$124,450
Interest Rate
7.18%
Purchase Details
Closed on
Apr 14, 1998
Sold by
Strand Monte S and Tijmann Sonja
Bought by
Adams Ralph E and Adams Rebecca E
Home Financials for this Owner
Home Financials are based on the most recent Mortgage that was taken out on this home.
Original Mortgage
$124,450
Interest Rate
7.18%
Create a Home Valuation Report for This Property
The Home Valuation Report is an in-depth analysis detailing your home's value as well as a comparison with similar homes in the area
Home Values in the Area
Average Home Value in this Area
Purchase History
| Date | Buyer | Sale Price | Title Company |
|---|---|---|---|
| Bilanski Christina S | $11,235 | First American | |
| Bilanski Christine S | $270,000 | First American | |
| Adams Rebecca E | -- | First American Title Co | |
| Adams Ralph E | $165,950 | Evergreen Title Company Inc |
Source: Public Records
Mortgage History
| Date | Status | Borrower | Loan Amount |
|---|---|---|---|
| Open | Bilanski Christine S | $170,000 | |
| Closed | Bilanski Christina S | $170,000 | |
| Previous Owner | Adams Ralph E | $124,450 |
Source: Public Records
Tax History Compared to Growth
Tax History
| Year | Tax Paid | Tax Assessment Tax Assessment Total Assessment is a certain percentage of the fair market value that is determined by local assessors to be the total taxable value of land and additions on the property. | Land | Improvement |
|---|---|---|---|---|
| 2025 | $6,468 | $801,600 | $601,000 | $200,600 |
| 2024 | $6,468 | $781,600 | $581,000 | $200,600 |
| 2023 | $6,747 | $852,800 | $606,000 | $246,800 |
| 2022 | $6,573 | $677,400 | $491,000 | $186,400 |
| 2020 | $6,265 | $568,800 | $385,000 | $183,800 |
| 2019 | $5,918 | $534,700 | $353,000 | $181,700 |
| 2018 | $5,831 | $464,100 | $302,000 | $162,100 |
| 2017 | $4,980 | $410,000 | $261,000 | $149,000 |
| 2016 | $4,534 | $374,200 | $231,000 | $143,200 |
| 2015 | $4,459 | $349,700 | $228,000 | $121,700 |
| 2013 | $3,346 | $247,400 | $147,000 | $100,400 |
Source: Public Records
Map
Nearby Homes
- 8825 231st Place SW
- 23121 Edmonds Way Unit 2
- 8614 Madrona Ln
- 22910 90th Ave W Unit C306
- 23015 Edmonds Way Unit A103
- 23227 92nd Ave W
- 23116 80th Place W
- 8017 234th St SW Unit 325
- 23601 Edmonds Way
- 8615 238th St SW Unit B101
- 7818 228th St SW Unit 106
- 9511 Edmonds Way
- 23727 80th Ct W
- 22604 78th Ave W
- 9526 234th St SW
- 23511 96th Ave W
- 8012 222nd St SW
- 7522 221st St SW
- 8517 242nd St SW Unit 402
- 7907 240th St SW
- 8617 231st St SW
- 8601 231st St SW
- 8525 231st St SW
- 8604 231st St SW
- 8616 231st St SW
- 8625 231st St SW
- 23107 86th Place W Unit 1
- 8526 231st St SW
- 23026 85th Ave W
- 23022 85th Ave W
- 23018 85th Ave W
- 23018 85th Ave W Unit 3
- 23014 85th Ave W
- 23111 86th Place W Unit 2
- 8606 231st St SW
- 22930 85th Place W
- 23110 86th Place W Unit 8
- 23008 85th Ave W
- 8524 231st St SW
- 8629 231st St SW