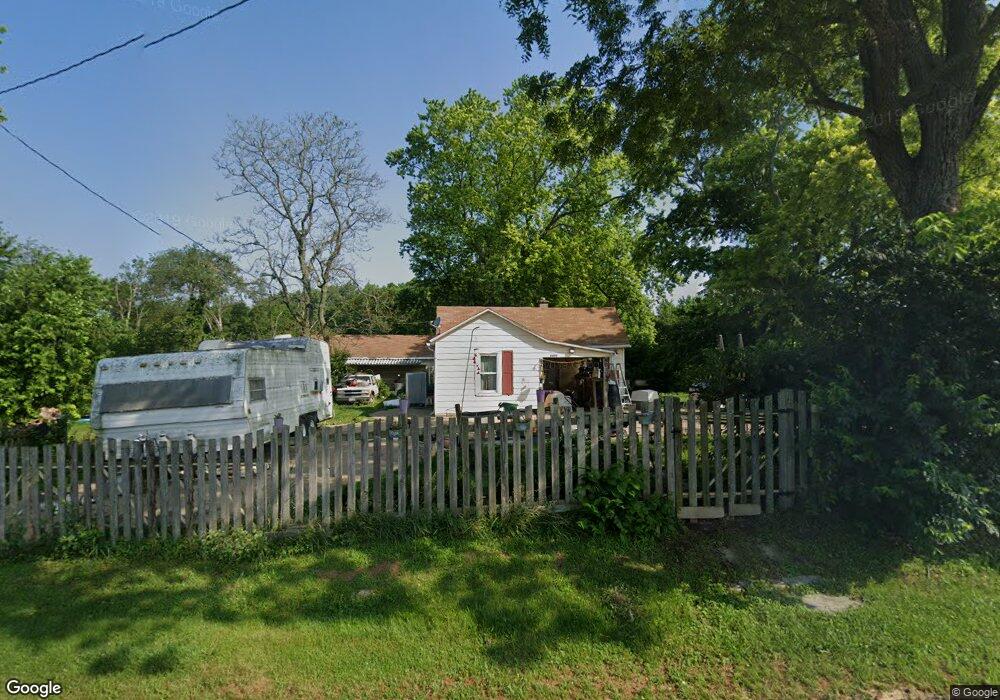
8605 Battin Howell Rd South Charleston, OH 45368
Estimated Value: $213,187 - $297,000
3
Beds
1
Bath
1,200
Sq Ft
$209/Sq Ft
Est. Value
About This Home
This home is located at 8605 Battin Howell Rd, South Charleston, OH 45368 and is currently estimated at $251,297, approximately $209 per square foot. 8605 Battin Howell Rd is a home located in Clark County with nearby schools including Miami View Elementary School and Southeastern Senior High School.
Ownership History
Date
Name
Owned For
Owner Type
Purchase Details
Closed on
Sep 12, 2006
Sold by
The Bank Of New York
Bought by
Coleman Michele L
Current Estimated Value
Home Financials for this Owner
Home Financials are based on the most recent Mortgage that was taken out on this home.
Original Mortgage
$60,720
Outstanding Balance
$36,286
Interest Rate
6.58%
Mortgage Type
Purchase Money Mortgage
Estimated Equity
$215,011
Purchase Details
Closed on
Mar 24, 2006
Sold by
Sagraves Molly K and Case #05Cv1039
Bought by
The Bank Of New York and Eqcc Asset Backed Certificates Series 20
Home Financials for this Owner
Home Financials are based on the most recent Mortgage that was taken out on this home.
Original Mortgage
$15,180
Interest Rate
6.49%
Mortgage Type
Stand Alone Second
Purchase Details
Closed on
Mar 20, 2000
Sold by
Pinkerman Carl W and Pinkerman Melissa K
Bought by
Sagraves Molly K and Sagraves Tyler S
Home Financials for this Owner
Home Financials are based on the most recent Mortgage that was taken out on this home.
Original Mortgage
$72,000
Interest Rate
9%
Create a Home Valuation Report for This Property
The Home Valuation Report is an in-depth analysis detailing your home's value as well as a comparison with similar homes in the area
Home Values in the Area
Average Home Value in this Area
Purchase History
| Date | Buyer | Sale Price | Title Company |
|---|---|---|---|
| Coleman Michele L | $75,900 | None Available | |
| The Bank Of New York | $56,667 | None Available | |
| Sagraves Molly K | $90,000 | -- |
Source: Public Records
Mortgage History
| Date | Status | Borrower | Loan Amount |
|---|---|---|---|
| Open | Coleman Michele L | $60,720 | |
| Previous Owner | The Bank Of New York | $15,180 | |
| Previous Owner | Sagraves Molly K | $72,000 | |
| Closed | Sagraves Molly K | $18,000 |
Source: Public Records
Tax History Compared to Growth
Tax History
| Year | Tax Paid | Tax Assessment Tax Assessment Total Assessment is a certain percentage of the fair market value that is determined by local assessors to be the total taxable value of land and additions on the property. | Land | Improvement |
|---|---|---|---|---|
| 2024 | $1,973 | $47,520 | $19,170 | $28,350 |
| 2023 | $1,973 | $47,520 | $19,170 | $28,350 |
| 2022 | $1,907 | $47,520 | $19,170 | $28,350 |
| 2021 | $1,550 | $34,280 | $13,590 | $20,690 |
| 2020 | $1,563 | $34,280 | $13,590 | $20,690 |
| 2019 | $1,583 | $34,280 | $13,590 | $20,690 |
| 2018 | $1,390 | $30,950 | $13,590 | $17,360 |
| 2017 | $1,386 | $30,951 | $13,594 | $17,357 |
| 2016 | $1,372 | $30,951 | $13,594 | $17,357 |
| 2015 | $1,267 | $27,689 | $12,359 | $15,330 |
| 2014 | $1,225 | $27,689 | $12,359 | $15,330 |
| 2013 | $1,226 | $27,689 | $12,359 | $15,330 |
Source: Public Records
Map
Nearby Homes
- 8425 Battin Howell Rd
- 5800 Old Columbus-Cincinnati Rd
- 5800 Old State Route 42
- 5001 S Charleston Clifton Rd
- 6480 N River Rd
- 3691 Kyle Rd
- 3725 Kyle Rd
- Tract 6 Buffenbarger Rd
- Tract 3 Buffenbarger Rd
- Tract 2 Buffenbarger Rd
- Tract 1 Buffenbarger Rd
- 3250 Mc Millan Rd
- 7646 N River Rd
- 5940 Dolly Varden Rd
- 7776 Clifton Rd
- 4817 N River Rd
- 2598 Selma Jamestown Rd
- 4860 S Pitchin Rd
- 3398 US Route 42 E
- 218 Fence Row Ln
- 8568 Battin Howell Rd
- 8560 Battin Howell Rd
- 8588 Battin Howell Rd
- 8489 Battin Howell Rd
- 8453 Battin Howell Rd
- 8410 Chillicothe Rd
- 8447 Battin Howell Rd
- 8435 Battin Howell Rd
- 8930 Chillicothe Rd
- 9000 Chillicothe Rd
- 8391 Battin Howell Rd
- 8825 Battin Howell Rd
- 9030 Chillicothe Rd
- 8367 Battin Howell Rd
- 9045 Chillicothe Pike
- 9045 Chillicothe Rd
- 8850 Battin Howell Rd
- 8125 Selma Rd
- 8250 Selma Rd
- 8240 Selma Rd