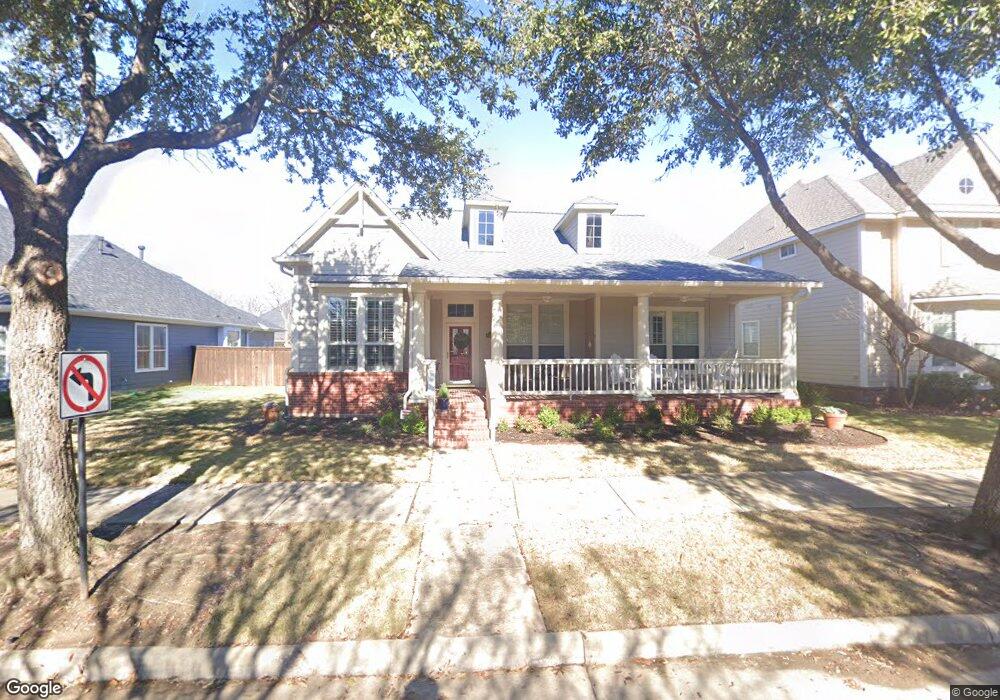
8605 Hudson St North Richland Hills, TX 76180
Estimated Value: $528,250 - $639,000
3
Beds
2
Baths
2,474
Sq Ft
$230/Sq Ft
Est. Value
About This Home
This home is located at 8605 Hudson St, North Richland Hills, TX 76180 and is currently estimated at $569,563, approximately $230 per square foot. 8605 Hudson St is a home located in Tarrant County with nearby schools including Walker Creek Elementary School, Smithfield Middle School, and Birdville High School.
Ownership History
Date
Name
Owned For
Owner Type
Purchase Details
Closed on
Jan 15, 2013
Sold by
Kettering Steven W and Kettering Gloria E
Bought by
Beacom John F and Beacom Margaret E
Current Estimated Value
Home Financials for this Owner
Home Financials are based on the most recent Mortgage that was taken out on this home.
Original Mortgage
$157,500
Outstanding Balance
$109,356
Interest Rate
3.34%
Mortgage Type
New Conventional
Estimated Equity
$460,207
Purchase Details
Closed on
Dec 17, 2003
Sold by
Weekley Homes Lp
Bought by
Kettering Steven W and Kettering Gloria E
Home Financials for this Owner
Home Financials are based on the most recent Mortgage that was taken out on this home.
Original Mortgage
$100,000
Interest Rate
5.97%
Mortgage Type
Purchase Money Mortgage
Purchase Details
Closed on
Aug 21, 2003
Sold by
Arcadia Land Partners 16 Ltd
Bought by
Weekley Homes Lp
Create a Home Valuation Report for This Property
The Home Valuation Report is an in-depth analysis detailing your home's value as well as a comparison with similar homes in the area
Home Values in the Area
Average Home Value in this Area
Purchase History
| Date | Buyer | Sale Price | Title Company |
|---|---|---|---|
| Beacom John F | -- | None Available | |
| Kettering Steven W | -- | -- | |
| Weekley Homes Lp | -- | Priority Title Company |
Source: Public Records
Mortgage History
| Date | Status | Borrower | Loan Amount |
|---|---|---|---|
| Open | Beacom John F | $157,500 | |
| Previous Owner | Kettering Steven W | $100,000 |
Source: Public Records
Tax History Compared to Growth
Tax History
| Year | Tax Paid | Tax Assessment Tax Assessment Total Assessment is a certain percentage of the fair market value that is determined by local assessors to be the total taxable value of land and additions on the property. | Land | Improvement |
|---|---|---|---|---|
| 2025 | $4,253 | $526,251 | $64,642 | $461,609 |
| 2024 | $4,253 | $526,251 | $64,642 | $461,609 |
| 2023 | $9,692 | $509,392 | $64,642 | $444,750 |
| 2022 | $9,665 | $442,844 | $64,642 | $378,202 |
| 2021 | $9,291 | $365,144 | $75,000 | $290,144 |
| 2020 | $9,080 | $356,843 | $75,000 | $281,843 |
| 2019 | $9,773 | $371,126 | $75,000 | $296,126 |
| 2018 | $6,430 | $341,836 | $75,000 | $266,836 |
| 2017 | $8,941 | $352,478 | $75,000 | $277,478 |
| 2016 | $8,129 | $302,120 | $40,000 | $262,120 |
| 2015 | $6,498 | $314,000 | $40,000 | $274,000 |
| 2014 | $6,498 | $314,000 | $40,000 | $274,000 |
Source: Public Records
Map
Nearby Homes
- 6001 Kessler Dr
- 6025 Kessler Dr
- 6008 Kessler Dr
- 8321 Bridge St
- 8908 Redding St
- 6008 Monterey Mews
- 7800 Mockingbird Ln Unit 29
- 7800 Mockingbird Ln Unit 81
- 7800 Mockingbird Ln Unit 73
- 7800 Mockingbird Ln Unit 43
- 7800 Mockingbird Ln Unit 205
- 6124 Mayfair Mews
- 6105 Parker Blvd
- 8240 Bridge St
- 8765 Bridge St
- 6116 Morningside Dr
- 6113 Cliffbrook Dr
- 8748 Morris Mews
- 6137 Marquita Mews
- 6017 Avalon St
- 8609 Hudson St
- 8601 Hudson St
- 8601 Hudson St
- 8613 Hudson St
- 8604 Olmstead Terrace
- 8600 Olmstead Terrace
- 5820 Arbor Rd
- 8608 Olmstead Terrace
- 8537 Hudson St
- 8612 Olmstead Terrace
- 5816 Arbor Rd
- 8536 Olmstead Terrace
- 8533 Hudson St
- 5813 Lake Way
- 5812 Arbor Rd
- 8616 Olmstead Terrace
- 8532 Olmstead Terrace
- 5946 Lake Way Mews
- 5817 Arbor Rd
- 8529 Hudson St